Today, we will look at the ways to use Parameters in Tableau. Parameters are values that you can easily change on the fly to alter the look of any of your graphs. Parameters are also unique in their ability to be constant across charts; this means that you only have to change the parameter once, and it can change all of your graphs. First, let's create a parameter. In order to create a parameter, you must have a place to use it. As usual, we will use the Superstore Sales sample data set in Tableau.
Step 1:
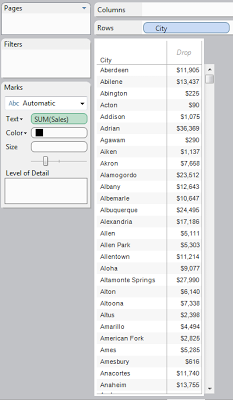 |
| Sales by City |
An analyst might say "Whoa, there are so many cities. I only want to see the cities where customers spend a lot, but I don't know how many I want." This is where parameters come in.
Step 2:
- Open the filter window for "City"
- Under the "Top" Tab, Select "By Field"
- Select "Top", "Sales", "Sum" leaving the "Number" Box empty
- In the "Number" Box, Select "Create New Parameter"
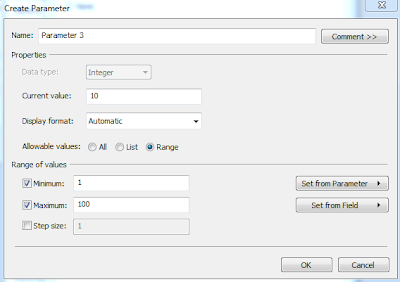 |
| Parameter Creation Window |
In this window, we have quite a few options. For a "Top N" case, we only want users to be able to select integers. We also want to limit their choices to a small number. So, let's create a parameter that ranges between 1 and 25, but defaults at 10.
Step 3:
- In the "Name" Box, Type "Top N"
- In the "Current Value" Box, Type "10"
- In the "Display Format" Box, Select "Automatic"
- Under "Allowable Values", Select the "Range" Bubble
- Under "Range of Values", Type "1", "25", "1"
.PNG) |
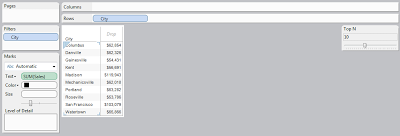
| Sales by Top N Cities |
Now, you can change the value of the parameter in order to change the number of cities that you see. You might also notice that, while the top N are being displayed, the data is not sorted in the manner. This seems unusual. You could easily go back and sort this data if you wanted. Also, if you click the arrow in the Top-Right corner of the "Top N" Card, you can change the display style of the card. Once a parameter is created, you can use it in your custom calculations as well. With this, there are endless possibilities using parameters. Thanks for reading.
Brad Llewellyn
Associate Consultant
Mariner, LLC
llewellyn.wb@gmail.com
https://www.linkedin.com/in/bradllewellyn


.PNG)
Hi Brad,
ReplyDeleteHope you are doing well!
I've a problem which needs parameter to select different calculations in the same sheet - MoM, WoW, QoQ and YoY. As these are at different level of Time hierarchy and there is a Date range filter which selects multiple time values so when I select MoM and a date range filter to show last 12 months, I get a table with last 12 months with their growth rate from previous month for MoM. But I need to show Growth rate on US map and there can only be one value as label.
I'm not sure if this is possible in it's current form and what can be the solution or alternative to it. If you want I can share the screenshot of the calculations.
Thanks!