Today, we're going to continue our walkthrough of Sample 4: Cross Validation for Regression: Auto Imports Dataset. In the previous posts, we walked through the
Initial Data Load, Imputation,
Ordinary Least Squares Linear Regression,
Online Gradient Descent Linear Regression,
Boosted Decision Tree Regression,
Poisson Regression and
Model Evaluation phases of the experiment.
 |
| Experiment So Far |
Let's refresh our memory on the data set.
 |
| Automobile Price Data (Clean) 1 |
 |
| Automobile Price Data (Clean) 2 |
We can see that this data set contains a bunch of text and numeric data about each vehicle, as well as its price. The goal of this experiment is to attempt to predict the price of the car based on these factors.
In the previous
post, we were able to calculate important evaluation statistics for our regression models,
R Squared being the most important. However, we left out a very important concept known as
Normalization.
Many statistical algorithms (including some regression algorithms) attempt to determine the "best" model by reducing the
variance of something (often the
residuals). However, this can be a problem when we are dealing with features on massively different scales. Let's start by considering the calculation for variance. The calculation starts by taking an individual value and subtracting the
mean (also known as average). This means that for very large values (like "Price" in our dataset), this difference will be very large, while for small values (like "Stroke" and "Bore" in our dataset), this difference will be very small. Then, we square this value, making the difference even larger (and always positive). Finally, we repeat this process for the rest of the values in the column, then add them together and divide by the number of records.
So, if we asked an algorithm to minimize this value across a number of different factors, we would find that it would almost always minimize the variance for the largest features, while completely ignoring the small features. Therefore, it would be extremely helpful if we could take all of our features, and put them on the same scale. This is what normalization does. Let's take a look at the module in Azure ML.
 |
| Normalize Data |
We can see that the "Normalize Data" module takes our data and applies a single "Transformation Method" to the columns of our choice. In this experiment, we'll stick with using the
ZScore transformation. We may dig deeper into the other methods in a later post. Also, we are choosing to exclude the "Price" column from our normalization. In most cases, there's not much harm in normalizing the dependent variable. However, we're withholding it for two reasons. First, if we were to normalize the "Price" column, then we would get normalized predictions out of the model. This would mean that we would have to reverse the transformation in order to get back to our original scale. Second, Poisson Regression requires a positive whole number as the dependent variable, which is not the case with normalization, which can and will produce positive and negative values centered around 0. Let's take a look at the visualization.
 |
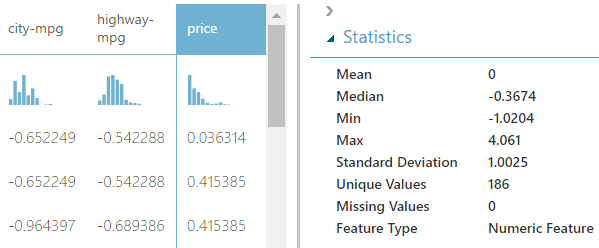
| Normalize Data (Visualization) |
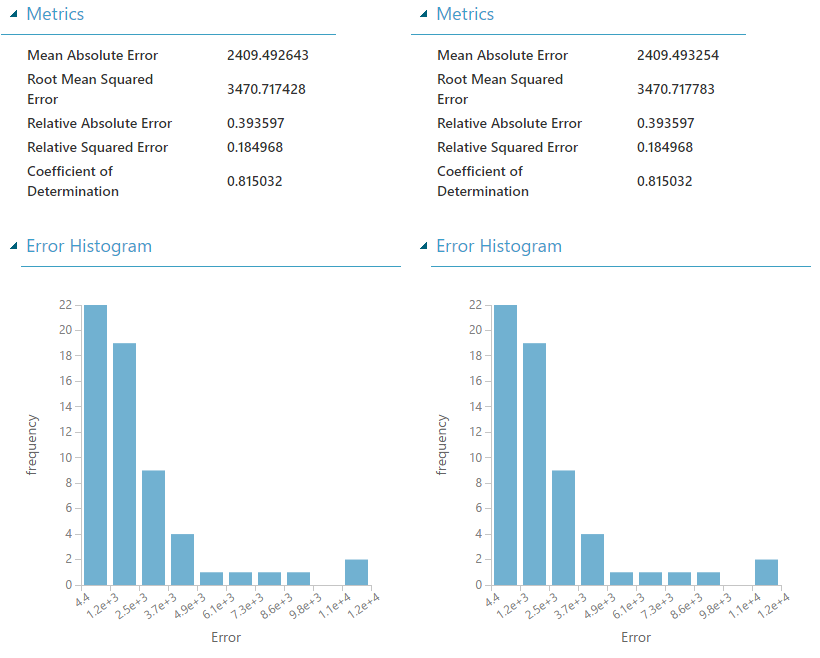
We can see that these values are no longer large whole numbers like they were before. Instead, they are small positive and negative decimals. It's important to note that the Mean and Standard Deviation of these normalized features are very close to 0 and 1, respectively. This is exactly what the ZScore transformation does. However, the true purpose of this normalization is to see if it has any impact on our regression models. Let's take a look. For all of these evaluations, the unmodified values are used in the left model and normalized values are used in the right model.
 |
| Ordinary Least Squares Linear Regression |
 |
| Online Gradient Descent Linear Regression |
 |
| Boosted Decision Tree Regression |
 |
| Poisson Regression |
Before we began this experiment, we already knew that Linear and Boosted Decision Tree Regression were robust against normalization (meaning that normalizing the features wouldn't have an impact). However, the MSDN article for
Poisson Regression specifically states that we should normalize our features. Given the underlying mathematics and the test we just conducted, we're not sure why this would be necessary. If anyone has any ideas, feel free to leave a comment. Alas, the point of this experiment is still valid. There are some algorithms where Normalizing features ahead of time is necessary. K-Means Clustering is one such algorithm.
With this in mind, we can conclusively say that Poisson Regression (without normalization) created the best model for our situation. Hopefully, this experiment has enlightened you to all the ways in which you can use Regression in your organization. Regression truly is one of the easiest techniques to use in order to gain tremendous value. Thanks for reading. We hope you found this informative.
Brad Llewellyn
Data Scientist
Valorem
@BreakingBI
www.linkedin.com/in/bradllewellyn
llewellyn.wb@gmail.com