Today, we're going to talk about ways to combine different data sources in Tableau. In particular, we will be talking about "Joining" and "Blending". Joining is a SQL term that refers to combining two data sources into a single data source. Blending is a Tableau term that refers to combining two data sources into a single chart. The main difference between them is that a join is done once at the data source and used for every chart, while a blend is done individually for each chart. Here's a picture we made a while ago illustrating the difference.
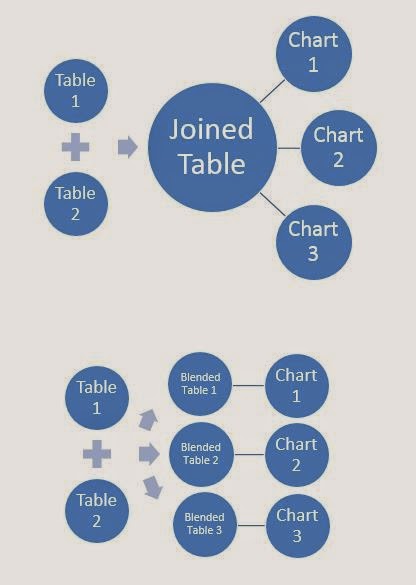 |
| Joining vs. Blending |
First, let's talk about restrictions for each of these methods. When you join, both of the data sources have to exist in the same SQL database, Excel workbook, or whatever other joinable data source you are using. Multidimensional Sources (aka Cubes) cannot be joined. On the other hand, you can blend data sources that come from completely different locations as long as the secondary source is not a cube. Therefore, blending is much more universally applicable than joining. However, it is much weaker in most situations and does not perform as well. To summarize, if joining will solve your problem, then you should join.
Now, let's look at a real world situation. We have the tab with all of our order information in it and we have another tab with the returned orders in it. We want to see which orders were returned. So, the question is, "Should we join or blend?" Well, let's take a look at the data.
 |
| Orders and Returns |
We see that both data sets contain an Order ID field. Also, we note that the Order ID field in the Returns data never repeats. This is great news when it comes to joining. So, we should just be able to join this data together and voila.
 |
| Returned Orders |
It should be noted that since the Returns tab did not contain every Order ID from the Orders tab, we needed to make this a Left Join. For more information on types of join, look
here. Also, if you would like an visual example of how we joined the data, there's a small set of pictures
here. In fairness, we could have achieved this exact same outcome with Blending. However, remember that Blending is less efficient than Joining and should only be used when a join will not work.
Now, let's move on to a situation where joining will not work. Let's say that I added a column to the Returns tab with the Refund Amount. Let's take a look.
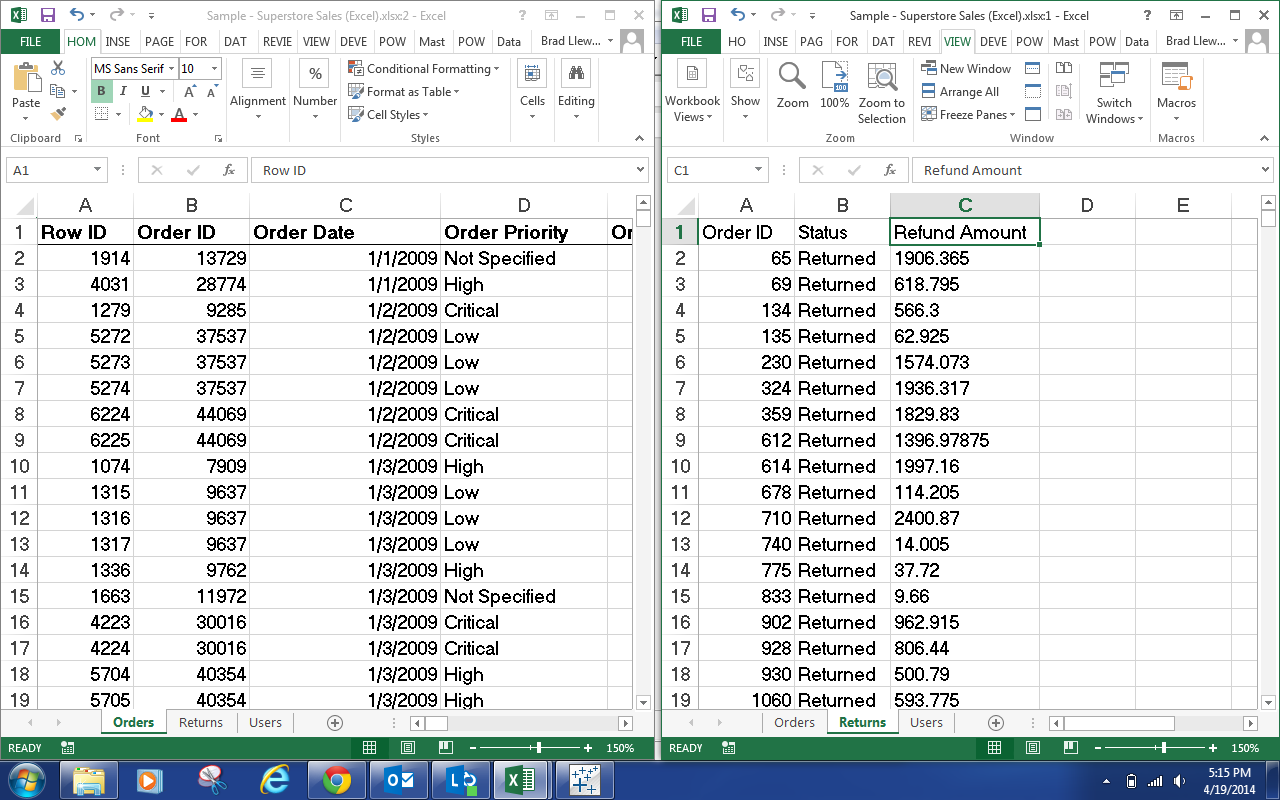 |
| Orders and Refunds |
Now, we want to know how much money we've refunded to customers. Let's start by attempting to join the data.
 |
| Duplicated Rows |
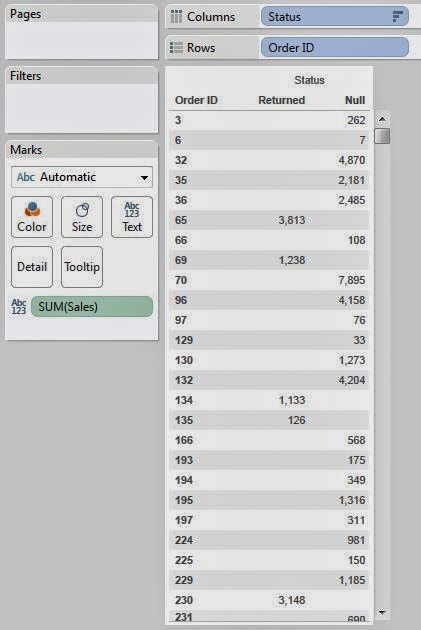
As you can see, there are multiple rows for this order. This caused the Refund Amount to duplicate for each row. This is because the Returns data is at the level of the Order ID, while the Order data is at the level of the Product within the Order (commonly known as the Order Line). In this case, we have two measures with different granularities. Therefore, we would need to aggregate our Orders data up to the Order ID level in order to join this data, and we don't want to do that. On the bright side, this is exactly what blending is meant for.
Let's start by talking about how Blending actually works. First, let's create a simple table.
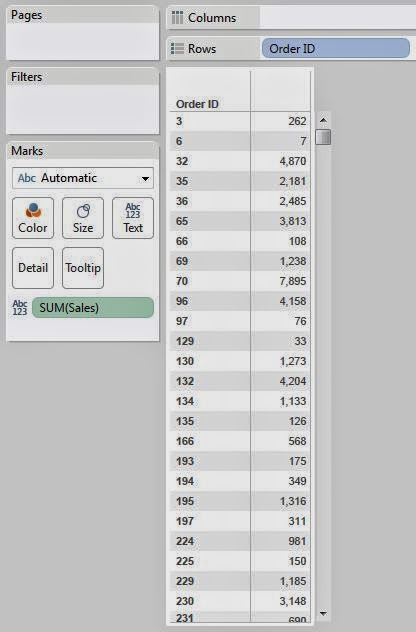 |
| Sales by Order ID |
When Tableau creates this table, it queries the data source for the appropriate data and stores the results in a temporary table known as the context. Then, this table is used to create the visualization, whether it is a chart, line graph, etc. When you are blending in another data source, it creates a similar temporary table from the secondary data source and performs a left join from the primary context to the secondary context. This way, it doesn't matter what level each of the data sources is at. All that matter is what level the chart is at. Now, let's blend in Refund Amount to see this in action.
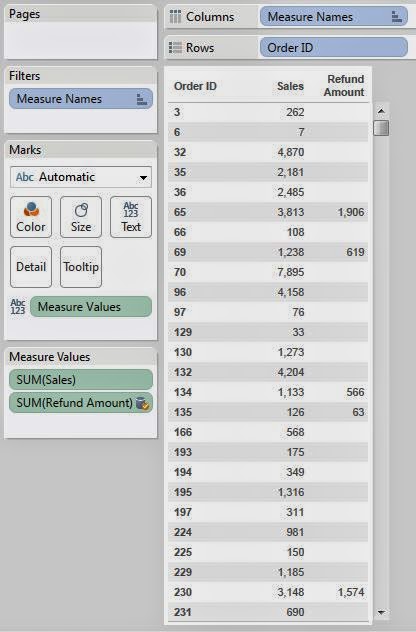 |
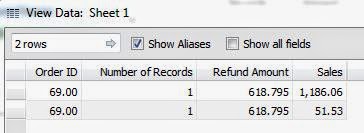
| Sales and Refunds by Order ID |
See how Order ID 69 has a refund amount of 619? That value was 1238 when we naively joined these data sources. This is just the evidence we need to say that our data blending worked. If you want more information about combining multiple data sources in Tableau, look
here. Thanks for reading. We hope you found this informative.
P.S.
We've never heard any official word on whether the temporary table used for Blending is the same as the context. However, we haven't found a reason to believe that it isn't. If you know for sure, please let us know in the comments.
Brad Llewellyn
Data Analytics Consultant
Mariner, LLC
llewellyn.wb@gmail.com
https://www.linkedin.com/in/bradllewellyn
