Monday, December 28, 2015

Level of Detail Calculations in Tableau Part 5: LoDs as Dimensions

Today, we're going to talk about using LoDs as Dimensions in Tableau.  Up until now, we've only been using LoDs as measures on our charts.  However, they can also be used as dimensions if you're careful.  One important caveat to note is that only FIXED LoDs can be used as dimensions because a dimension can not depend on what is already in the chart.  This is why Table Calculations are always measures.  Let's start by looking at ways to classify customers.  What if we wanted to classify customers by the number of unprofitable items they've bought?
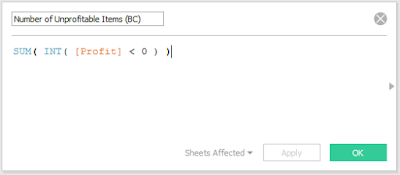
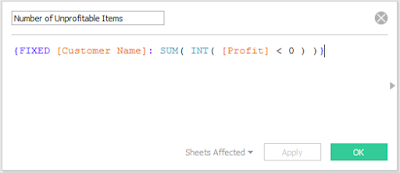
Number of Unprofitable Items
The inner expression [Profit] < 0 flags each row with a TRUE/FALSE if it's an unprofitable item.  Then, we change those to 1/0 values and sum them up by customer.  If we drag this onto the chart as a dimension, it actually gets pushed down to the row-level of our underlying data, as if it were a dimension in the data set.  This allows us to apply measures on top of it.
Number of Customers by Number of Unprofitable Items
You can even view the underlying data to confirm that the calculation works.
Number of Customers by Number of Unprofitable Items (with Underlying Data)
Unfortunately, the Number of Unprofitable Items field will not appear in the underlying data because it's calculated at runtime.  Alas, this does give you some way to double check your calculations.

Since this field is now a dimension, we can even filter on it.
Sales by Year for Customers with at Least 3 Unprofitable Items
We do warn you to be careful with these types of situations, you may end up with incorrect calculations.  For instance, when you have year on the chart, does the LoD calculate for each year or does it calculate once, filter the underlying data source, and make a chart based on the filtered data source?  Our intuition says the latter.  Let's test it.
Number of Unprofitable Items (BC)
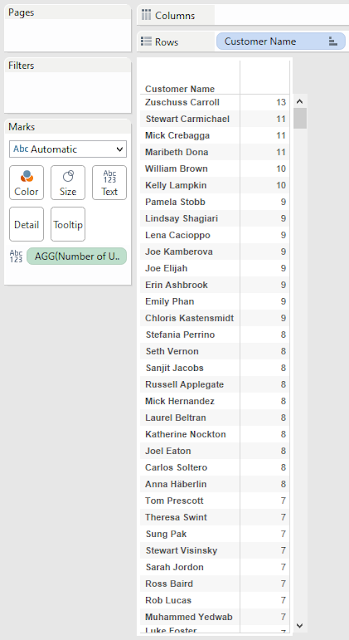
Number of Unprofitable Items by Customer
We can see that Zuschuss Carroll is the only customer with 13 unprofitable items.  Let's see what his/her Sales by Year are.
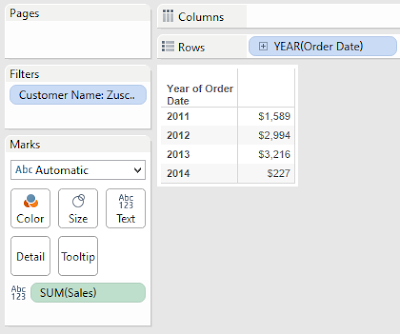
Sales by Year (Zuschuss Caroll)
His/her Sales for 2011 is $1,589.  Next, let's filter our first Sales by Year chart to show "exactly 13" Unprofitable Items instead of "at least 3".
Sales by Year for Customers with 13 Unprofitable Items
This is exactly what we saw when we filtered on Zuschuss Caroll directly.  This is amazing news.  We now know that filtering by an LoD does not take into account what's on the chart.  What about the other side?  When the LoD is placed on a chart, does it take into account the filters?
Sales by Number of Unprofitable Items for 2011
We see that $1,589 is the same number we saw when we filtered on Zuschuss Caroll.  This isn't especially surprising.  In Part 2, we established that FIXED LoDs always compute before traditional filters.  This brings up another interesting question.  What happens if we add the Year filter to the Context?
Sales by Number of Unprofitable Items for 2011 (Context)
There is no longer a row for 13.  This signals to us that the filter is taking place BEFORE the LoD.  It's a great sign to the simplicity of LoDs that the reality matches our expectations.  However, let's take it one step further.  What happens if you add an LoD filter to Context?  Does an infinite loop within Tableau rip a hole in the universe?  Let's find out.
Unprofitable Items by Year and Customer
The first numeric column you see is the LoD.  As we now know, it doesn't care if Year is also in the chart, it calculates across all years.  After that, we see the Basic Calculation version calculated for each year, followed by the total.  For now, this total matches the LoD.  Let's see what happens when we filter out rows with an LoD equal to 0.
Unprofitable Items by Year and Customer (Traditional Filter)
It filters out all rows with an LoD value of 0, as we expected.  Now, what happens if we add this filter to Context?
Unprofitable Items by Year and Customer (Context Filter) 
Nothing happens.  The filter acts the same whether it is context or traditional.  The real question is "How does this context filter interact with other filters?"  An LoD should always be calculated after Context Filters and before Traditional Filters.  This would lead us to believe that the following order takes place:

1) Non-LoD Context Filters are computed
2) FIXED LoDs are computed
3) Context is recomputed using LoD Context filter
4) Traditional filters are computed

This seems somewhat inefficient.  Calculating the Context can be quite cumbersome depending on your data.  Calculating it twice would make it even worse.  Let's see if this is the case.
Sales by Year for Customers with 13 Unprofitable Items (Context)
We've seen this chart before.  Now, what will happen if we add a traditional filter for 2011.  The LoD filter should calculate first, then the Year filter.  This means that the only row in the output should be 2011 with a value of $1,589.
Sales for Customers with 13 Unprofitable Items in 2011 (Traditional)
So far, so good.  Now, let's add the Year filter to Context.  If our above hunch was correct, the chart should go blank.  This would indicate that the Year filter is being taken into account before the LoD is calculated, thereby requiring the Context to be build twice.

Sales for Customers with 13 Unprofitable Items in 2011 (Context) v2
Interestingly enough, we were wrong.  The Year context filter was not calculated before the LoD.  This is an interesting find.  For one, it means that Tableau's not as inefficient as we expected it to be.  Second, it means that we found an exception to the "Context before FIXED" rule. In fact, it seems that ALL context filters, regardless of origin, are calculated before other FIXED LoDs.  This brings up another interesting question.  Is there any way to have a FIXED Context Filter affected by other filters?  It doesn't seem like it.  Alas, maybe someone will leave a comment with an idea.

That's all we're going to discuss about this today.  We learned a tremendous amount about LoDs and hope you did too.  Thanks for reading.  We hope you found this informative.

The workbook for this post can be found here.

Brad Llewellyn
Business Intelligence Consultant
llewellyn.wb@gmail.com
http://www.linkedin.com/in/bradllewellyn

Monday, December 14, 2015

Level of Detail Calculations in Tableau Part 4: How do they work?

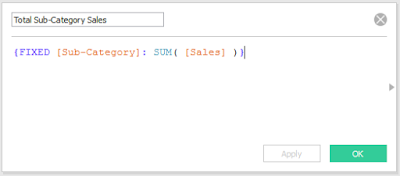
Today, we're going to talk about using how Level of Detail Calculations work inside Tableau.  This is an extremely complex topic that could easily span its own series.  Alas, we'll try to touch on the basics.  Let's start with a simple LoD.  For this example, we'll use the Total Sub-Category Sales.
Total Sub-Category Sales
Judging by the syntax, this LoD calculates the SUM( [Sales] ) at the Sub-Category level.  What does it do with this information?  First, it creates an underlying table for this calculation.
Total Sub-Category Sales (Underlying Table)
We don't get to see this table, but it's still there.  Since this is a FIXED calculation, it also takes into account any data source or context filters that may be applied.  In this case, we don't have any of those.  So, what happens next?  This depends on the granularity of the chart that you're asking Tableau for.  Let's start by decreasing the granularity (less rows in the chart) by choosing to aggregate by Category.  Depending on your industry, this may also be referred to as going "Up the Hierarchy" or "Rolling Up".
Sales and Total Sub-Category Sales by Category
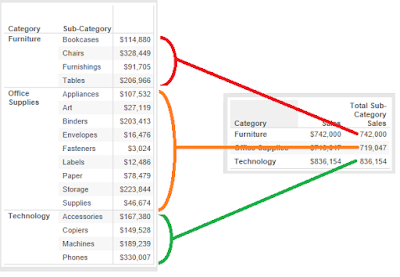
As you can see, when you attempt to roll up this aggregation, it takes the underlying Sub-Category Sales table, and sums it up to the category level.  Here's a rudimentary illustration.
Aggregation
Generally, summing a sum is not the most useful operation.  You can achieve the same result without the headache by just summing the values all the way through.  However, this does become more useful when you want to see things like the max of the sums, or the sum of the maxes.

Now, let's move on to the next level, Disaggregating.  Disaggregating is the exact opposite of Aggregation because you are increasing the granularity of the chart.  This may also be known as "Rolling Down", "Drilling Down", or "Down the Hierarchy".  To illustrate this, we'll use Manufacturer as our dimension.
Sales and Total Category Sales by Sub-Category and Manufacturer
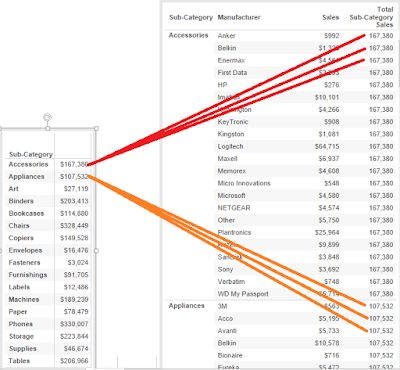
As you can see, the Total Sub-Category Sales are the same for every manufacturer within the Sub-Category.  Why is this?  Well, this chart has the Sub-Category dimension in it already.  Therefore, Tableau simply takes our underlying table of Sales by Sub-Category, and appends it on to each row of the chart.
Appending
These two processes are pretty simple.  But, what if the dimension in your chart is completely unrelated to Sub-Category?  Let's find out by using Segment.
Sales and Total Sub-Category Sales by Segment
As you can see, the Total Sub-Category Sales is equal to the total sales (minus some rounding error).  Since Segment and Sub-Category are "unrelated", the sum of the Total Sub-Category Sales is the total sales.  However, what does it mean to be unrelated?
Total Sub-Category Sales by Segment and Sub-Category
Turns out that every combination of Segment and Sub-Category exists in our context.  Therefore, the sums will always be the same.  Some of you might be saying "But my data has holes in it!"  Holes are an extremely common part of data analysis and should always be considered.  So, what happens if we swap out Segment for State?
Total Sub-Category Sales by State and Sub-Category
As you can see, this cross-section has holes in it.  So, what do you think happens when you remove Sub-Category from the canvas?
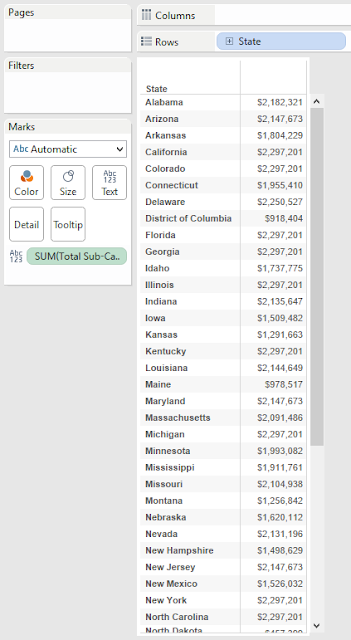
Total Sub-Category Sales by State
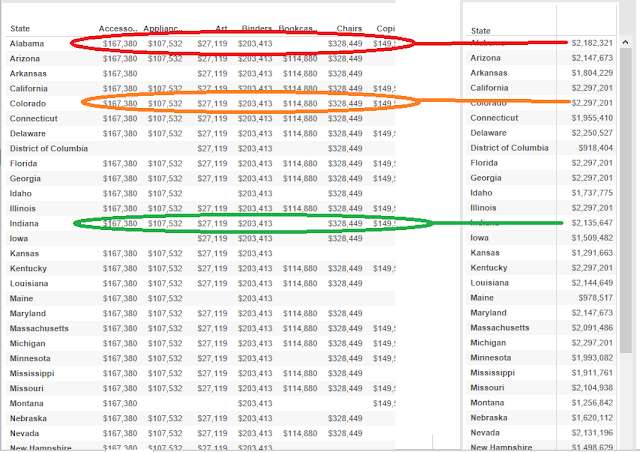
You can see that most of the states don't add up to the Total Sales.  This is caused by the holes.  Here's a small illustration for you.
Incomplete Aggregation
That's pretty much all the basics for LoDs.  We've seen that when you use an LoD, Tableau creates an underlying table(s) and either appends or aggregates them to you chart.  Don't worry though.  There's plenty more amazing ways that Tableau uses LoDs.  Hopefully, we've laid the groundwork for many LoDs to come.  Thanks for reading.  We hope you found this informative.

The workbook for this post can be found here.

Brad Llewellyn
Business Intelligence Consultant
llewellyn.wb@gmail.com
http://www.linkedin.com/in/bradllewellyn

Monday, November 30, 2015

Level of Detail Calculations in Tableau Part 3: Distinct Counts

Today, we're going to talk about creating Distinct Counts in Tableau.  Primarily, we're going to focus on how to create them using Level of Detail (LoD) Calculations.  Then, we're going to compare LoDs to Table Calculations (TC) and Basic Calculations (BC) from the perspective of Ease of Creation, Flexibility and Performance.  We will not be covering in-depth how to create the Basic and Table Caclulation versions of the metrics.  COUNTD() is a built-in BC and you can read this post for the TC.  For these analyses, we will be using the Superstore Sales data set repeated 1000 times to create a data set that contains 10 million rows.

Metric 1: Total Distinct Rows

Let's start at the top level.  What if you wanted to know the Total Distinct Count of a field in your data set?
Distinct Rows (LoD)
Since we're looking for an overall Total, we want to use FIXED.  Our calculation in this case is COUNTD().  Let's check out the results.
Total Distinct Rows (LoD)
We can see that we get one number and you can take our word for it that this number is correct.  Now, on to the interesting part.  How does this compare to using BC or TC?  BC would simply require us to use the COUNTD() with no FIXED wrapper, whereas a TC would require us to add the Row IDs to the canvas, then aggregate them out using another TC.  

From a ease of creation standpoint, BC is by far the simplest because COUNTD() is a built-in function.  LoD comes in second because it's the same calculation wrapped in a FIXED expression.  TC comes very far in last because it requires multiple TCs wrapped around some non-sensical functions (SUM() of a MAX() to be precise).

From a flexibility standpoint, BC and LoD tie for first.  BC would allow you to add any dimensions you want to the chart, but the value will change to represent what's in the chart.  On the other hand, adding a dimension to the chart would not change the LoD.  However, you could change the way you calculate your LoD in order account additional dimensions.  Again, TC come in last because adding a new dimension to the chart would probably require you to update your Compute Using in order to allow for accurate results.

Finally, let's look at the Performance Monitor.
Total Distinct Rows (PM)
As we can see, there was no performance difference between BC and LoD, whereas TC took almost 10 seconds to load this simple calculation.  This is an easy decision

VERDICT: BC if you want it to respond to added dimensions, LoD if you don't.

Metric 2: Distinct Customers that purchased at least 1 item over $100 by Category

This question is a little more difficult.  We have to be able to identify which items cost over $100.  Fortunately, our data is already at the item level.  So, this problem comes down to using a traditional filter.  We want to start by adding [Sales] to the filter shelf.  Not SUM( [Sales] ), just [Sales].  You can achieve this by right-click-dragging [Sales] to the filter shelf, and selecting "All Values" or you can drag [Sales] to the dimensions shelf, then to the filter shelf.  The choice is yours.  This filter will remove all rows from the underlying data that have a [Sales] value less than 100.  Now, there are two ways we can approach this, using INCLUDE/EXCLUDE or using FIXED.  Let's start with INCLUDE/EXCLUDE.
Distinct Customers (INCLUDE)
Distinct Customers with an item over $100 by Segment (INCLUDE)
We saw in Part 2 of this series that INCLUDE/EXCLUDE LoDs are calculated AFTER traditional filters.  Therefore, simply making this an INCLUDE/EXCLUDE LoD with no dimension allows it to be calculated after the filter.  Let's look at the FIXED version.

Distinct Customers (FIXED)
Distinct Customers with an item over $100 by Segment (FIXED) (incorrect)
Hmmm.  There's an issue here.  The numbers aren't the same as before.  Part 2 also mentioned that FIXED LoDs are calculated BEFORE traditional filters.  This means that this LoD sees ALL Customers, not just the ones we've filtered for.  We can alleviate this by adding the Sales filter to the Context (which is created before FIXED LoDs).
Distinct Customers with an item over $100 by Segment (FIXED)
Voila.  It works.  Now, let's consider the comparison.

From an ease of creation standpoint, BC wins again due to the fact that we're using a built-in calculation.  LoD runs in a close second, but does require some extra knowledge about order of operations in Tableau.  Finally, TC is just as unwieldy here as it was before.

The story is the same as last time from a flexibility standpoint.  It all depends on what your next step is.  If you want to continually add and remove dimensions to flow through your analysis, then BC is what you want.  However, if you want these totals to stay the same while you run simultaneous analyses, then a FIXED LoD is what you need.  We can't think of any reason why you would want to use an INCLUDE/EXCLUDE LoD in this situation instead of BC, but that doesn't mean there isn't one.  Lastly, TC suffers from the same issues it did on the first metric.  Compute Using is not going to be your friend in this case.

Let's check out the Performance.
Distinct Customers with an item over $100 by Segment (PM)
There doesn't seem to any discernable difference between most of the Calculation Types.  This is actually surprising because of how poorly TC performed in the first test.  It just goes to show that TCs can be very useful when there aren't a large number of marks on the chart.

VERDICT: BC if you want it to respond to added dimensions, FIXED LoD if you don't.

Metric 3: Distinct Customers who spent at least $100 in 2013 by Segment.

While this metric may seem very similar to the previous one, there is one major difference.  Our data is not at the Year level, it's at the Order Line level.  That means that the underlying data set cannot be used to identify a Customer who spent $100 in 2013.  This means that BC is completely off the table.  Our only options now are TC and LoD.  Let's try it out.
Distinct Customers who spent at $100 (INCLUDE)
Distinct Customers who spent at least $100 in 2013 by Segment (INCLUDE)
This is when LoDs start to begin causing headaches.  We can filter the chart down to 2013 to start.  Next, we need to identify which customers spent more than $100.  Finally, we need to typecast the Boolean (T/F) values to Numeric (1/0) values.  Then, we can add those up.  An interesting thing to note about this data set is that each Customer ID exists in only 1 segment.  This means that we can use FIXED to exploit this for some extra efficiency.
Distinct Customers who spent at $100 (FIXED)
Distinct Customers who spent at least $100 in 2013 by Segment (FIXED)
Adding the filter to context, and changing the word INCLUDE to FIXED does the trick.  If the relationship between Customer ID and Segment wasn't perfectly cascading, then we would also need to have Segment in our FIXED partition.  Now, let's take a look at the comparison.

From an ease of use standpoint, they feel pretty similar.  It more comes down to what you're comfortable with.  Personally, we're more comfortable with TC because that's what we're much more experienced with.  However, the more we work with LoDs, the more see their value.

From a flexibility standpoint, we'd have to say that the INCLUDE LoD wins out.  It allows you to add any dimension to the chart you would like and the calculation will still work.  However, if you were add another dimension, Category for instance, you will get double counting because a customer is likely to have purchased from more than one Category.

Finally, let's look at the performance monitor.
Distinct Customers who spent at least $100 in 2013 by Segment (PM)
Turns out that there was no performance difference between INCLUDE and FIXED.  This is likely due to the cascading relationship between the two.  However, there was a massive performance difference (more than 3x) between TC and LoD.  Given what we've seen so far, we're willing to bet that this gap would grow even more as the number of marks gets larger.

VERDICT: LoD because of a significant performance increase.

Throughout this post, we've seen that there are multiple ways to approach each type of problem.  As far as distinct counts go, it seems that you should use COUNTD() whenever you can.  If you can't, then LoD is probably the next best option.  Thanks for reading.  We hope you found this informative.

The workbook for this post can be found here.

Brad Llewellyn
Business Intelligence Consultant
llewellyn.wb@gmail.com
http://www.linkedin.com/in/bradllewellyn
Monday, November 16, 2015

Level of Detail Calculations in Tableau Part 2: Fixed, Include and Exclude

Today, we're going to explore the 3 types of Level of Detail (LoD) Calculations in Tableau.  They each have their own strengths and weaknesses.

LoD Type 1: FIXED

FIXED is arguably the simplest LoD to use in Tableau.  It calculates the same value, the same way regardless of the viz you put it in.  Let's see a simple example.  We start with a chart that shows Sales by Category and Sub-category.
Sales by Category and Sub-category
Let's try to append Total Sales onto this chart.  Total Sales is a fixed calculation because it doesn't care which fields are in the chart.  It wants ALL sales.  The syntax for an LoD is as follows:

{ (LoD Type) [Dimension1], [Dimension2], etc. : Metric }

Overall Total Sales
Sales and Overall Total Sales by Category and Sub-category
Since we want Overall Total Sales, our LoD Type is going to be FIXED, we don't have any dimensions, and our metric is SUM( [Sales] ).  As you can see, this is quite simple to write and works perfectly when you drag it on the chart.  If you read Part 1, you will remember that high-level aggregations like this are not affecting by the outside aggregation.  Therefore, changing the SUM() to a MAX() does not affect the value in the chart.  We'll touch more on that in a later post.
Sales and Overall Total Sales by Category and Sub-Category (with MAX())
LoD Type 2: INCLUDE

INCLUDE is a slightly more advanced type of LoD.  An Include LoD looks at all of the dimensions in your chart, and adds another dimension to the list.  For instance, let's look at Sales by Category.
Sales by Category
Now, what if we wanted to know the Sales for the largest Sub-category within each Category.  We can simply INCLUDE Sub-category to solve this.
Sales of Largest Sub-category
This calculation will take the Dimensions in the chart (Category) and combine with the included Dimensions (Sub-category) to create a table of SUM( [Sales] ) by Category and Sub-category.
Sales by Category and Sub-category (again)
Now, if we set the overlying aggregation to be MAX(), it will take the maximum Sub-category Sales within each Category.  This is what we see on our final chart.
Sales of Largest Sub-category by Category
A quick comparison to the LoD table confirms that our calculations are correct.
Sales by Category and Sub-category (with Largest Sub-categories highlighted)
An astute reader might note that this calculation could also have been done using

{FIXED [Category], [Sub-category]: SUM( [Sales] )}

This is correct.  In fact, most of the simple calculations can be done using a number of different calculations.  The real differences come when the calculations get more advanced.  But that's for a later post.

LoD Type 3: EXCLUDE

EXCLUDE works the exact opposite of INCLUDE.  It removes a dimension that currently exists in your viz.  For instance, let's start with a chart of Sales by Category and Sub-category.
Sales by Category and Sub-category (for the 3rd time)
We want to calculate the Total Sales within each Category.
Total Category Sales
Sales and Total Category Sales by Category and Sub-category
It should be noted that when you are using INCLUDE and EXCLUDE, the value of the LoD may change if you change your viz.  For instance, let's take Category out of the above chart.
Sales and Total Category Sales by Sub-category (or not)
Using EXCLUDE to remove Sub-category now leaves us with no dimensions, which causes the Total Category Sales to reflect Overall Total Sales instead.  For this reason, it's generally a good idea to accurately name your calculations.  For instance, "Total Category Sales" should be "Sales Excluding Sub-category".

The final key difference between these 3 LoD Types is how they interact with filters.  FIXED LoDs are designed to work independently of the chart.  Therefore, their values are not affected by traditional filters.  They see what the chart sees (also known as the context).  However, INCLUDE and EXCLUDE LoD's are designed to work in the confines of a single viz.  Therefore, they are affected by traditional filters.  This leaves us with the following order of calculation.

1) Data Source Filters
2) Context Filters
3) FIXED LoDs
4) Traditional Filters
5) INCLUDE and EXCLUDE LoDs

We still have a tremendous amount of room to explore the great new feature of Level of Detail Calculations.  Thanks for reading.  We hope you found this informative.

The workbook for this post can be found here.

P.S.

A couple users on the Tableau forums pointed me towards this graphic which I think tells the story perfectly.

Brad Llewellyn
Director, Consumer Sciences
Consumer Orbit
llewellyn.wb@gmail.com
http://www.linkedin.com/in/bradllewellyn