 |
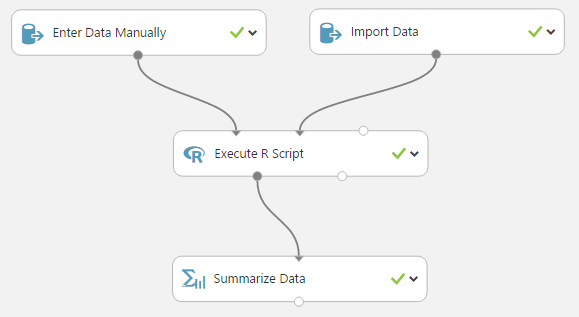
| Sample 1 Workflow |
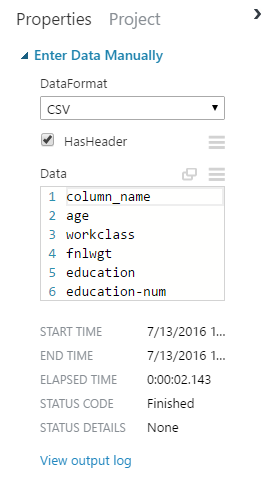 |
| Enter Data Manually |
Record Starts at UTC 07/13/2016 15:48:39:

Run the job:"/dll "Microsoft.Analytics.Modules.EnterData.Dll, Version=6.0.0.0, Culture=neutral, PublicKeyToken=69c3241e6f0468ca;Microsoft.Analytics.Modules.EnterData.Dll.EnterData;Run" /Output0 "..\..\dataset\dataset.dataset" /dataFormat "CSV" /data "empty" /hasHeader "True"  /ContextFile "..\..\_context\ContextFile.txt""
[Start] Program::Main
[Start]     DataLabModuleDescriptionParser::ParseModuleDescriptionString
[Stop]     DataLabModuleDescriptionParser::ParseModuleDescriptionString. Duration = 00:00:00.0047673
[Start]     DllModuleMethod::DllModuleMethod
[Stop]     DllModuleMethod::DllModuleMethod. Duration = 00:00:00.0000228
[Start]     DllModuleMethod::Execute
[Start]         DataLabModuleBinder::BindModuleMethod
[Verbose]             moduleMethodDescription Microsoft.Analytics.Modules.EnterData.Dll, Version=6.0.0.0, Culture=neutral, PublicKeyToken=69c3241e6f0468ca;Microsoft.Analytics.Modules.EnterData.Dll.EnterData;Run
[Verbose]             assemblyFullName Microsoft.Analytics.Modules.EnterData.Dll, Version=6.0.0.0, Culture=neutral, PublicKeyToken=69c3241e6f0468ca
[Start]             DataLabModuleBinder::LoadModuleAssembly
[Verbose]                 Loaded moduleAssembly Microsoft.Analytics.Modules.EnterData.Dll, Version=6.0.0.0, Culture=neutral, PublicKeyToken=69c3241e6f0468ca
[Stop]             DataLabModuleBinder::LoadModuleAssembly. Duration = 00:00:00.0081428
[Verbose]             moduleTypeName Microsoft.Analytics.Modules.EnterData.Dll.EnterData
[Verbose]             moduleMethodName Run
[Information]             Module FriendlyName : Enter Data Manually
[Information]             Module Release Status : Release
[Stop]         DataLabModuleBinder::BindModuleMethod. Duration = 00:00:00.0111598
[Start]         ParameterArgumentBinder::InitializeParameterValues
[Verbose]             parameterInfos count = 3
[Verbose]             parameterInfos[0] name = dataFormat , type = Microsoft.Analytics.Modules.EnterData.Dll.EnterData+EnterDataDataFormat
[Verbose]             Converted string 'CSV' to enum of type Microsoft.Analytics.Modules.EnterData.Dll.EnterData+EnterDataDataFormat
[Verbose]             parameterInfos[1] name = data , type = System.IO.StreamReader
[Verbose]             parameterInfos[2] name = hasHeader , type = System.Boolean
[Verbose]             Converted string 'True' to value of type System.Boolean
[Stop]         ParameterArgumentBinder::InitializeParameterValues. Duration = 00:00:00.0258120
[Verbose]         Begin invoking method Run ...
[Verbose]         End invoking method Run
[Start]         DataLabOutputManager::ManageModuleReturnValue
[Verbose]             moduleReturnType = System.Tuple`1[T1]
[Start]             DataLabOutputManager::ConvertTupleOutputToFiles
[Verbose]                 tupleType = System.Tuple`1[Microsoft.Numerics.Data.Local.DataTable]
[Verbose]                 outputName Output0
[Start]                 DataTableDatasetHandler::HandleOutput
[Start]                     SidecarFiles::CreateVisualizationFiles
[Information]                         Creating dataset.visualization with key visualization...
[Stop]                     SidecarFiles::CreateVisualizationFiles. Duration = 00:00:00.1242780
[Start]                     SidecarFiles::CreateDatatableSchemaFile
[Information]                         SidecarFiles::CreateDatatableSchemaFile creating "..\..\dataset\dataset.schema"
[Stop]                     SidecarFiles::CreateDatatableSchemaFile. Duration = 00:00:00.0121113
[Start]                     SidecarFiles::CreateMetadataFile
[Information]                         SidecarFiles::CreateMetadataFile creating "..\..\dataset\dataset.metadata"
[Stop]                     SidecarFiles::CreateMetadataFile. Duration = 00:00:00.0055093
[Stop]                 DataTableDatasetHandler::HandleOutput. Duration = 00:00:00.5321402
[Stop]             DataLabOutputManager::ConvertTupleOutputToFiles. Duration = 00:00:00.5639918
[Stop]         DataLabOutputManager::ManageModuleReturnValue. Duration = 00:00:00.5668404
[Verbose]         {"InputParameters":{"Generic":{"dataFormat":"CSV","hasHeader":true},"Unknown":["Key: data, ValueType : System.IO.StreamReader"]},"OutputParameters":[{"Rows":15,"Columns":1,"estimatedSize":0,"ColumnTypes":{"System.String":1},"IsComplete":true,"Statistics":{"0":[15,0]}}],"ModuleType":"Microsoft.Analytics.Modules.EnterData.Dll","ModuleVersion":" Version=6.0.0.0","AdditionalModuleInfo":"Microsoft.Analytics.Modules.EnterData.Dll, Version=6.0.0.0, Culture=neutral, PublicKeyToken=69c3241e6f0468ca;Microsoft.Analytics.Modules.EnterData.Dll.EnterData;Run","Errors":"","Warnings":[],"Duration":"00:00:00.8298274"}
[Stop]     DllModuleMethod::Execute. Duration = 00:00:00.8603897
[Stop] Program::Main. Duration = 00:00:01.0831653
Module finished after a runtime of 00:00:01.1406311 with exit code 0

Record Ends at UTC 07/13/2016 15:48:40.
Yikes! This appears to be written in the language underpinning Azure ML. There are some cool things to notice. You can see that some tasks have durations. This would be great for debugging. Let's stay away from these outputs as they seem to be above our pay grade (for now!).
For those of you that have experience with ETL tools like SSIS or Alteryx, you'll recognize that it's a pain sometimes to have to store the output of every single item in case you have to debug. Well, Azure ML makes this really easy. Many of the items have a Visualize option that you can access by right-clicking on the item after a successful run.
 |
| Enter Data Manually (Visualize) |
 |
| Enter Data Manually (Visualization) |
Let's move on to the other input item, Import Data.
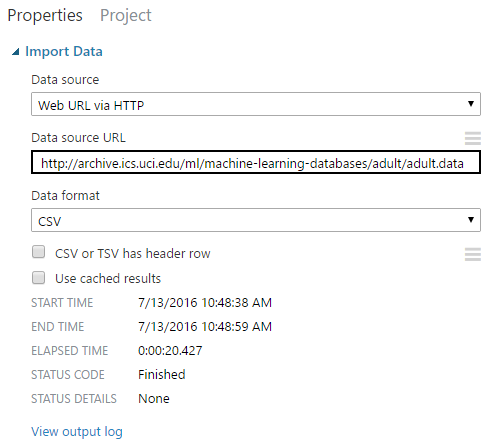 |
| Import Data |
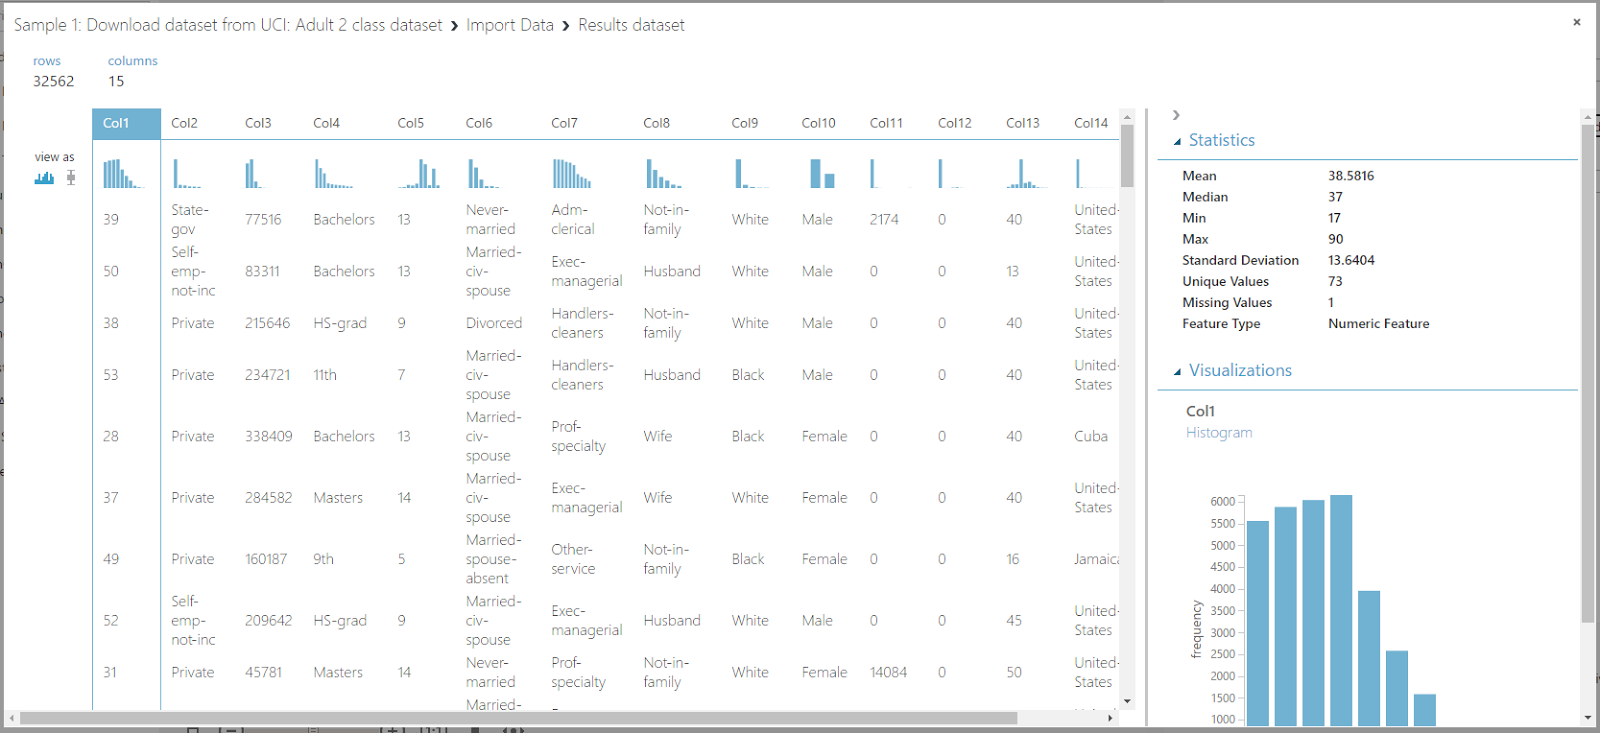 |
| Import Data (Visualization) |
 |
| Import Data (Box Plots) |
 |
| Import Data (Save As Dataset) |
 |
| Saved Datasets |
 |
| Execute R Script |
# Map 1-based optional input ports to variables
dataset1 <- maml.mapInputPort(1) # class: data.frame
dataset2 <- maml.mapInputPort(2) # class: data.frame
# Contents of optional Zip port are in ./src/
# source("src/yourfile.R");
# load("src/yourData.rdata");
# Sample operation
colnames(dataset2) <- c(dataset1['column_name'])$column_name;
data.set = dataset2;
# You'll see this output in the R Device port.
# It'll have your stdout, stderr and PNG graphics device(s).
#plot(data.set);
# Select data.frame to be sent to the output Dataset port
maml.mapOutputPort("data.set");
Whoever wrote this code did a good job of commenting, which makes it really easy to see what this does. The two input data sets (column names and data) are stored as dataset1 and dataset2. These two data sets are combined into a single data frame with the column names as the headers and the data as the data. In R terminology, a data frame is very similar to a table in Excel or SQL. It has a table name, column names, as well as values within each column. Also, the values in different columns can be of different data types, as long as values within a single column are of a single data type. Finally, this script outputs the data frame. So, if we use the Visualize feature, we should see an identical data set to what we from Import Data, albeit with proper column names attached.
 |
| Execute R Script (Visualization) |
 |
| Execute R Script (R Device) |
 |
| Execute R Script (R Log) |
Before we move on to the final item, we'd like to point out the "Run Selected" you can see by right-clicking on any tool in the workspace option. When we initially saw this, we thought it would allow us to run only this tool using a cached set of data. This would be a gamechanger when you are dealing with lengthy data import times. However, this option runs the selected item, as well as any necessary items preceding it. This is still really cool as it allows you to run segments of your experiment, but not as groundbreaking as we initially thought. Let's move on to the "Summarize Data" item.
 |
| Summarize Data |
Hopefully, this piqued your interest in Azure ML (it definitely did for us!). Join us next time when we walk through the next Sample to see what cool stuff Azure ML has in store. Thanks for reading. We hope you found this informative.
Brad Llewellyn
BI Engineer
Valorem Consulting
@BreakingBI
www.linkedin.com/in/bradllewellyn
llewellyn.wb@gmail.com