Tuesday, May 27, 2014

Data Mining in Excel Part 4: Re-Labelling your Data

Today, we will talk about the second portion of the "Clean Data" feature of the Data Mining Add-in for Excel, "Re-Label".
Clean Data
While the Outlier feature was useful for removing extreme numeric observations, the Re-Label feature allows to you change string values.  As usual, we will be using the Data Mining Sample Data from Microsoft.  Let's skip the foreplay and jump right into it.
Select Source Data
Of course, the first step is to select our data set.
Select Column
Then, we select the column where we would like to Re-label some values.  For this example, let's choose Education.
Re-Label Education
Now, we can proceed to Re-label these columns in any way we want.  For instance, what if we aren't interested in Partial College education?  If they didn't get the degree, then their education is High School.  That's an easy change here.
Partial College -> High School
We aren't forced to choose from existing options either.  What if we want more consistent labels?  We can easily alter each label to look a little more professional.
Professional Titles
This isn't all we can do either!  What if we were Insurance Adjusters and we needed to rate these people.  We could assign points to them based on their level of education.  More education means more points, leading to a lower insurance premium.
Points
As you can see, this is all really easy to do.  In fact, there was an interesting anecdote in the Data Mining book we mentioned in the first post of this series.  A man was presenting the Data Mining tool in a foreign country.  At the start of his presentation, he noticed that the entire data set was in English.  In a matter of minutes, he was able to translate the entire data set into their native language just by using this feature.  We have no idea if this actually happened or not.  But, after using this feature, we don't have any doubts that it could be done.  Now, what do we do with these labels?  We have a couple of options.
Select Destination
We can append the new column to our data, copy the changes into a new worksheet, or just replace the data where it is.  We recommend appending columns because it's typically not a good idea to outright change your data.
Data with Points
Now that we've re-labelled our data, it's time to move on with our analysis.  Unfortunately, you're just going to have to wait for the next post.  In the next entry, we'll be talking about the Sample data feature which allows you to easily chop up giant data sets into smaller ones for improved performance without losing any statistical significance.  Thanks for reading.  We hope you found this informative.

Brad Llewellyn
Data Analytics Consultant
Mariner, LLC
llewellyn.wb@gmail.com
https://www.linkedin.com/in/bradllewellyn

Monday, May 19, 2014

Data Mining in Excel Part 3: Cleaning Outliers

Today, we will talk about the second feature in the Data Preparation Segment, Clean Data.
Data Preparation Segment
Most data that a business analyst would work with would probably not be perfectly clean.  There would be empty values, misspelled values, and worse.  This feature is designed to alleviate some of that.  When you click on "Clean Data", you have two options, Outliers and Re-Label.  In this post, we will be talking about the Outliers portion of this feature.
Clean Data
We added some bad income values to the data set.  So, how do I know if they are there?
Income (with -1)
The Explore Data feature we talked about in the previous post is perfect for this.  We can easily see that there are a large number of bad values in the Income column.  Now, let's get rid of them using the Outliers portion of the Clean Data feature.
Income Outliers
This feature shows us the distribution of our data again and we can see the same spike at -1 we saw before.  Unfortunately, this tool doesn't show us the values on the bottom axis, which is very disappointing.  However, it is pretty cool because you can move the sliders and see what data you would be removing.
Income Outliers (with Sliders)
However, in our case, we only need to remove the -1 values.  So, if we set the minimum at 0 and click "Next", we get a set of options.
Outlier Handling
Each of these options is useful in its own way.  For instance, if you were dealing with percentages, then you would want to cap the percentages at 0% and 100%.  So, you would use the "Change value to specified limits" feature in that case.  If you were interested in looking at the distribution of this column without this data, then you would either want to change these values to Null or delete the rows altogether.  You should only delete the rows if you have no need for any of the other information.  In some very rare cases, you want want to replace the values with the mean (average) value.  This process as a whole is called "Imputation".  If you're interested, you can learn more here.  For our case, we want to remove these observations because we only care about income.
Select Destination
Lastly, we need to decide whether or not we want to copy the data to a new sheet or change the data where it is.  You should be extremely careful when working with real data because you typically don't want to delete data.  If you're experimenting with Data Mining, it's best to always use a copy of the data.
Income (Clean)
Now that we've cleaned the data, we see that -1 values are gone.  Now, we can move on with our analysis.  Stay tuned for our next post where we'll talk about the Re-Label portion of the Clean Data feature.  Thanks for reading.  We hope you found this informative.

Brad Llewellyn
Data Analytics Consultant
Mariner, LLC
llewellyn.wb@gmail.com
https://www.linkedin.com/in/bradllewellyn

Monday, May 12, 2014

Data Mining in Excel Part 2: Exploring your Data

Today, we'll talk about our first component of the Data Mining add-in for Excel, Explore Data.  We are beginning our analysis with the Data Preparation Segment of the Data Mining Ribbon.
Data Preparation Segment
The first component in this segment is the Explore Data feature.  This feature is pretty cool because it allows  you to look at the distribution of any column in your data set.  As usual, we will use the Data Mining Sample data from Microsoft.
Sample Data
In this data set, we have some categorical (slicer) columns like Gender and Education.  We also some discrete numeric columns such as children and cars.  So, how do we get a good feeling for what kind of distribution our data has.  Let's click on the Explore Data button and find out!
Select Data Source
The first step is to select the data source.  Since our data is in a table, the option is automatically selected.  You can enter a range if you'd like as well.  Moving on.
Select Column
Here, you can select any column you want by either scrolling through the dropdown box at the top or just clicking on the column in the sample window.  Once you select a column, you can see its distribution by clicking "Next".
Marital Status
We can quickly see that their are more married people than single people, about 20% more.  Now, we can easily click "Back" and move on to any other column we want.
Occupation
Choosing a column with more values leads to a much more interesting chart.  These charts could have easily been done using Excel's built-in features.  However, let's see what happens when we use this on a numeric column like Income.
Income (8 Buckets)
The tool automatically recognizes that this is a numeric value and discretizes it into 8 buckets.  If we wanted to see all of the values, we could click on the bar icon in the bottom-left corner of the window.  We could also change the number of buckets dynamically if we want more or less.  The really cool part of this feature happens when you click "Add New Column".
Appended Column
A discretized column was automatically appended to the data set.  As you can see, none of these features would be overly difficult to do with Excel.  The advantage of using this feature is being able to see it all quickly with just a few clicks.  Stay tuned for our next post where we talk about the "Outliers" portion of the "Clean Data" feature.  Thanks for reading.  We hope you found this informative.

Brad Llewellyn
Data Analytics Consultant
Mariner, LLC
llewellyn.wb@gmail.com
https://www.linkedin.com/in/bradllewellyn

Monday, May 5, 2014

Data Mining in Excel Part 1: Introduction

Today, we're beginning a new series about Data Mining.  Unlike my previous posts, this series will not focus on Tableau, but instead will focus on everyone's favorite analytics tool, Microsoft Excel.  The terms "Data Mining" and "Predictive Analytics" have been tossed around quite a bit recently and a lot of you might be wondering exactly what they mean.  In my mind, they revolve around predicting "unknown values."  This unknown value can range anywhere from "How many units will I ship next month?" to "Will this customer buy my product?" and even as far as "Which presidential party is likely to win the 2040 election?"

These questions are not new to industry by any means.  In fact, people have probably been budgeting since trade first began.  However, even with all of the current technology, quite a few companies still budget by getting a bunch of account managers in the room and basically guessing what they will earn next year.  This guess is based off of business knowledge, but typically with very little mathematical thought.  We won't go into a diatribe about human perception, but we will say that people have been shown to be terrible estimators.

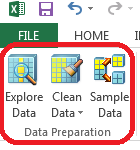
So, why don't we use some of these really cool tools we have to do the math for us?  Well, the algorithms have been around for decades.  We think the issue is that they've remained solely in the realm of Mathematicians and Computer Programmers.  It doesn't take long for a businessman to throw away a tool like R or SAS when they see that it requires years of mathematical education and learning an entirely new programming language to even get started.  This is where we think the Data Mining tools within Microsoft Excel shine.  They require almost no knowledge to get started and are as easy as clicking a few buttons on your Excel ribbon.  However, it seems that almost none of the business users we've spoken even know that they exist.  For some reason, they think that data mining requires a multi-million dollar investment in software and resources.

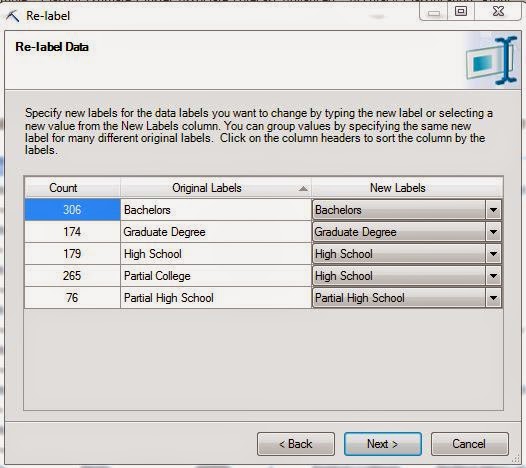
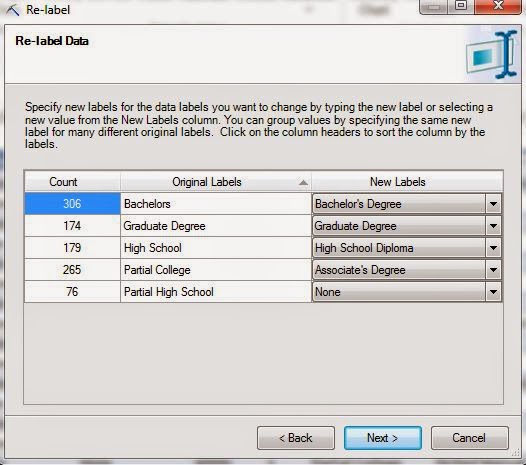
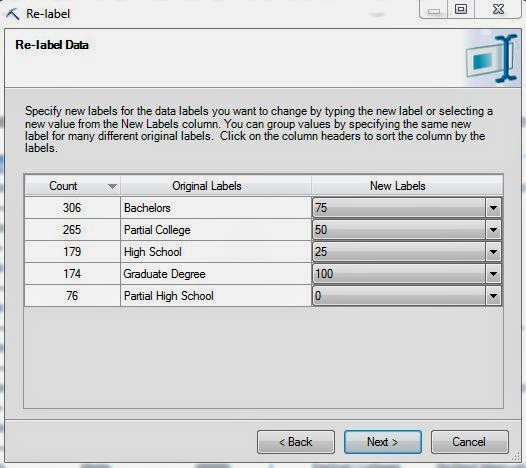
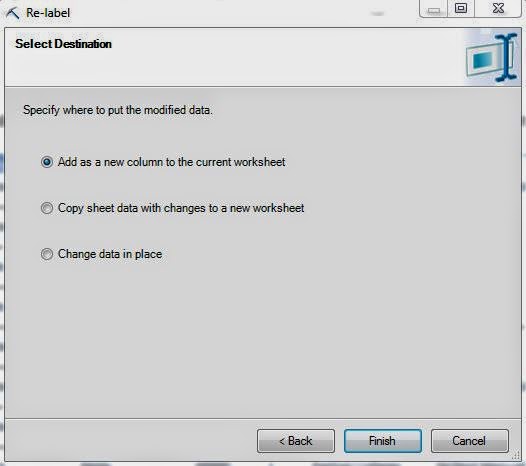
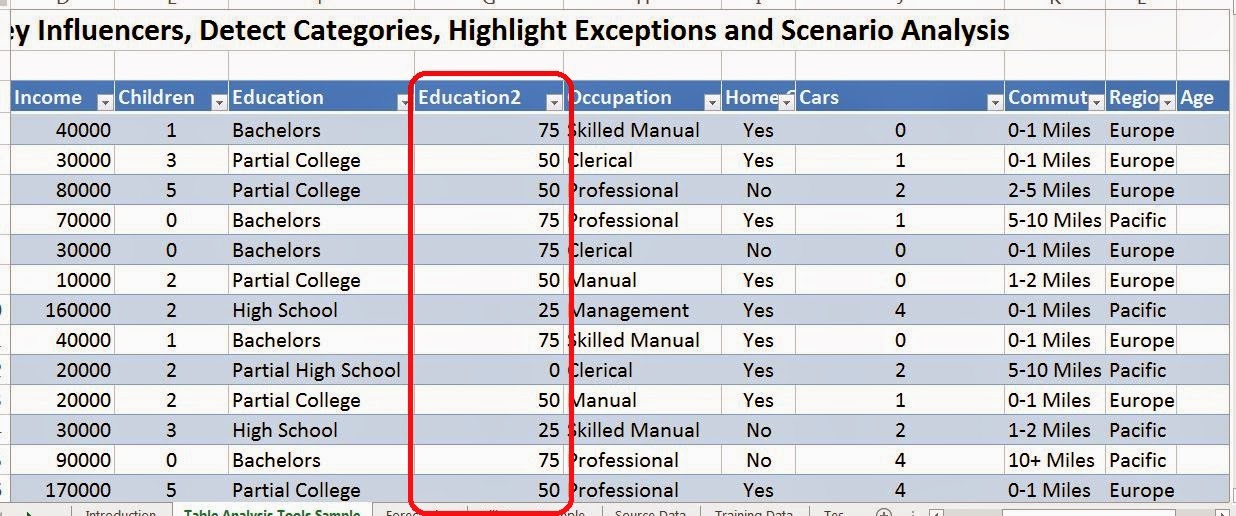
We're here to show you differently.  Throughout this series, we'll show you that all it takes to get real results using your data is a few minutes of basic data prep and the imagination to ask the questions that are important to your business.  Another great bonus of using these tools within Excel is that they play nicely with Power Query and Power Pivot, the data integration and analytics tools within Microsoft's Power BI stack.

In order to use these tools, you will need access to SQL Server Analysis Services (SSAS) 2008 or higher.  Unfortunately, I do not think you can find a free copy of SSAS.  However, if your company has anything resembling an IT department, it's very likely that they have at least one instance.  All you need is access to the instance and be allowed to create mining models.  They don't even need to give you access to the production server or anything.

Once you have access to SSAS, the rest of the tools are free downloads.

Data Mining Add-in for Excel (Excel 2007, 2010, 2013):
http://www.microsoft.com/en-us/download/details.aspx?id=7294

Data Mining Sample Data:
https://dataminingaddins.codeplex.com/releases/view/87029

Power Pivot (Excel 2010, 2013):
http://office.microsoft.com/en-us/excel/download-power-pivot-HA101959985.aspx

Power Query (Excel 2013):
http://www.microsoft.com/en-us/download/details.aspx?id=39379

It should be noted that Microsoft's official stance is that there is no interaction between Power Pivot and the Data Mining Add-ins.  They are technically correct but we'll show you some very simple ways to combine them.  There's also a book on this topic that we found to be extremely helpful.

Data Mining with Microsoft SQL Server 2008:
http://www.amazon.com/Data-Mining-Microsoft-Server-2008/dp/0470277742

We look forward to exploring these tools with you.  Thanks for reading.  We hope you found this informative.

Brad Llewellyn
Data Analytics Consultant
Mariner, LLC
llewellyn.wb@gmail.com
https://www.linkedin.com/in/bradllewellyn