Today, we're going to look at one of the newest additions to Tableau v9, Level of Detail (LoD) calculations. For a long time, our vizzes have been constrained by only being able to look at one "level of detail" at a time. What's a level of detail, you ask? A level of detail, also called the "grain" or "level of aggregation" is what Tableau sees when it tries to build your chart. For instance, let's say you want a simple chart, Sales over Time. You see this
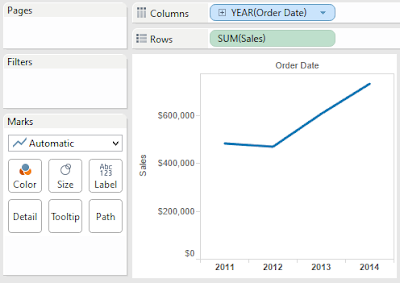 |
| Sales by Year (Line Chart) |
However, Tableau sees this
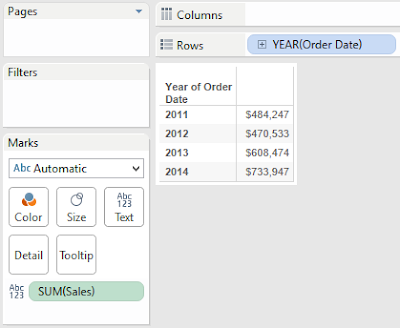 |
| Sales by Year (Table) |
Tableau looks at your data source, adds up the Sales for each Year, then uses that table to draw your viz. The issue with this is approach comes when you want to ask more questions. What if you want to compare the Sales for each Year to the overall total? Since the invention of Tableau, we've had to use table calculations to do this. Basically, the table calculation would require Tableau to build the Sales by Year table, then sum all of the values in that table to get the Overall Total. Next, it would have to append that value back to the table just to create the viz.
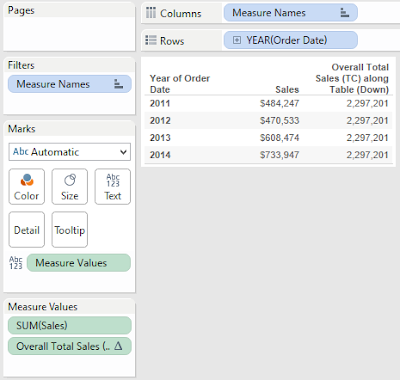 |
| Sales and Overall Total Sales |
If that sounds like a big circle, it's because it is. As many of you have seen, as this underlying table gets larger and the table calculation gets more and more complex, the table calculation can get quite slow.
This is where Level of Detail calculations come in. We could accomplish this simple task by using a level of detail calculation as well.
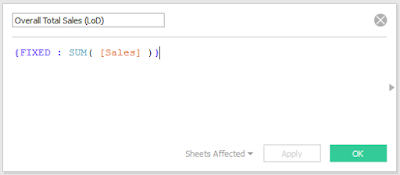 |
| Overall Total Sales (LoD) |
 |
| Sales and Overall Total Sales by Year (TC and LoD) |
As you can see, we simply tell Tableau to calculate the value and everything magically works. The question is "What is Tableau doing to make this work?"
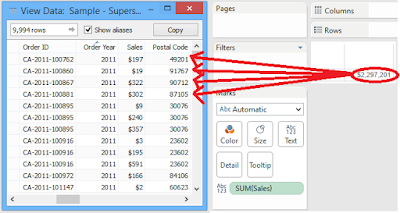 |
| Appending Overall Total Sales to Underlying Data |
We originally thought that Tableau dives into the underlying data, calculates the Total Overall Sales, then appends that value back to the underlying data. However, that doesn't seem to be the case. If you drag that field onto the chart, it calculates it using the ATTR() function.
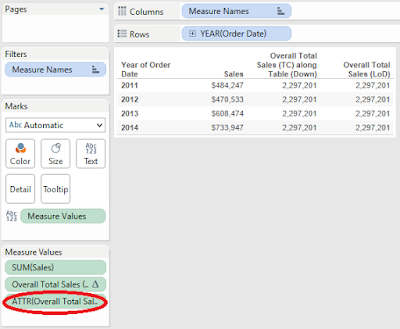 |
| ATTR() |
This function looks at every row in the underlying data source. If every row has the same value, it returns that value. If not, it returns *. Since the LoD was calculated across ALL rows, the value is going to be the same across all rows. After all, there is only one total. This leads us to a question, "What would happen if you changed that aggregation to SUM() instead of ATTR()?"
 |
| Sales and Overall Total Sales by Year (with SUM()) |
Surprisingly, it doesn't change. Apparently, Tableau is taking that 1x1 table of Overall Total Sales, and appending it to the Sales by Year table. As usual, we have another question, "How does this differ from Table Calculations?" They both calculate values and append them to the Yearly table. However, Table Calculations can only use values within the Yearly table. This means that if you wanted to append Maximum Monthly Sales within that Year, you would not be able to use a Table Calculation because Month is not in the table. However, LoDs can do that easily.
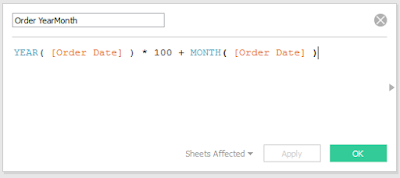 |
| Order YearMonth |
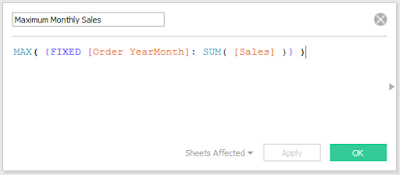 |
| Maximum Monthly Sales |
For some reason, Tableau will not let you use formula when you are defining the partition for your LoD. So, we had to create a unique identifier for every month and year in a separate calculation. Then, we simply tell Tableau to calculate the Sum( [Sales]) for each month and year, then take the MAX().
 |
| Sales and Maximum Monthly Sales by Year |
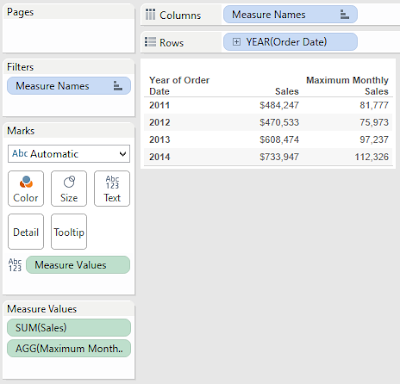
As you can see, Tableau found the largest monthly sales for each year. This situation differs from the one we saw previously because changing the aggregation does change the result. With a little investigation, it seems that Tableau creates a separate table for the LoD calculation, and appends it the "best" way it can. In the case of Overall Total Sales, the calculation was fixed on Year and Year was in the table. So, it was able to append the Year value directly to the table. However, in this case, Month is not in the table. So, it takes the external LoD table containing on the Sales by Month, and rolls it up to the Year level based on the aggregation we give it (in this case MAX()). The cool thing about LoDs is that they can also adapt to new dimensions being added to the chart.
 |
| Sales and Maximum Monthly Sales by Year and Quarter |
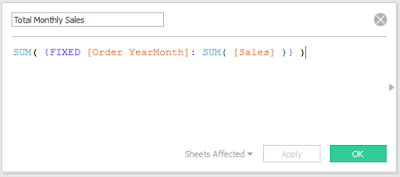
We see that the Maximum Monthly Sales has updated to calculate by Year and Quarter, instead of by Year. This is not unique to LoDs by any means. An intelligently designed Table Calculation will do this as well. However, let's ask the same question we asked before. This is the Maximum value, what happens if we change MAX() to SUM()? Will we still get the same answer?
 |
| Total Monthly Sales |
 |
| Sales, Maximum and Total Monthly Sales by Year |
Sadly, we do not get the same answer. However, every time we asked a question, we got the answer we wanted. This is very interesting an opens up a whole slew of questions. What's happening behind the scenes to make this happen? In situations where there is more than one approach, which one will perform the best or is the easiest to maintain? What kinds of problems can LoDs solve that were previously unsolvable? These are the kinds of questions we will look into throughout. Please join us on our adventure as we explore this strange new option of Level of Detail Calculations. Thanks for reading. We hope you found this informative.
The workbook for this post can be found
here.
Brad Llewellyn
Director, Consumer Sciences
Consumer Orbit
llewellyn.wb@gmail.com
http://www.linkedin.com/in/bradllewellyn


nice post
ReplyDeleteHej Brad!
ReplyDeleteI do not understand why you did Year([Order Date])*100+ Month([Order Date]).
Why Year([Order Date])*100?
Same question. Please answer.
Delete