Today, we will talk about the LOOKUP() function in Tableau. The LOOKUP() function allows you to find values that exist elsewhere in your table, or not in the table at all. At its most basic, it returns a value from a different row in the partition. It works exactly like INDEX(), TOTAL(), and all of the WINDOW functions. As usual, we will use the Superstore Sales sample data set in Tableau.
Step 1:
- Create a table!!!
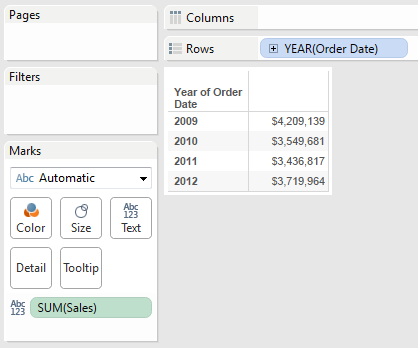 |
| Sales by Year |
Now, let's create a simple lookup that returns the sales from the previous year.
Step 2:
- Lookup SUM( [Sales] ) from the previous year
- Create the following calculated field
 |
| Previous Year Sales |
.PNG) |
| Sales by Year (with Previous Year Sales) |
Remember how we defined our LOOKUP() location as -1? That means it looks one space backwards in the partition. So, what would happen if we changed the order of the year?
Step 3:
- Change the sort order of the years to be descending.
.PNG) |
| Sales by Year (with Next Year Sales) |
The calculation changed from previous year to next year, without us having the change the formula. This is the extremely important aspect of the LOOKUP() function. We can also use this LOOKUP() value in calculations.
Step 4:
- Change the sort order back to ascending
- Calculate the YoY Growth
- Create the following calculated field
 |
| YoY Sales Growth |
Now, let's see if it works.
.PNG) |
| Sales by Year (with YoY Growth) |
Now that we have a basic understand of how LOOKUP() works, let's talk about 2 great uses for it.
Use 1: Coercing a calculation to be a table calculation.
You might be asking "Why would we want a calculation to become a table calculation?" If you remember an earlier post, Creating Table Calculations on Values outside of the Filter Range, you know that table calculations are calculated after other calculations. This means that if we can force a calculation to be a table calculation, we can control WHEN it is calculated. This is extremely important in more complex scenarios. Check out that post for a specific case where it is helpful. The important aspect to recognize about this use is that SUM( [Sales] ) and LOOKUP( SUM( [Sales] ), 0 ) return exactly the same value, yet are calculated at different times.
Use 2: Looking up values across time.
This is a huge category that very few people will ever fully utilize. To emphasize it, I will show you a very extreme example, you can look up virtually any types of values you want simply by sorting your data in different ways. First, we created the following calculated field:
Here's what it did:
 |
| Sales from Same Place in Previous Partition |
 |
| Sales by Quarter (with Sales from Same Place in Previous Partition) |
LOOKUP() is one of the most powerful functions in Tableau. There are so many ways to exploit these features to calculate some truly incredibly values. I hope you found this informative. Thanks for reading.
Brad Llewellyn
Associate Consultant
Mariner, LLC
llewellyn.wb@gmail.com
https://www.linkedin.com/in/bradllewellyn
https://www.linkedin.com/in/bradllewellyn
Nice article. Thanks for that.
ReplyDeleteQuick question. What happens when there is no exact prior year match?
I'll elaborate. i am getting unexpected results when trying to lookup a prior year's value based on same month-day of this year when the prior year does not have that month-day in the data. (working with store data where the stores are not open every day)
Ideally, when this happens, i just want missing/null returned (equivalent to what happens when using exact match in excel v or h lookup).
everything is working as expected except for those days that have no month-date match during the prior year.
It appears what's happening is that tableau is trying to pull a value from the next closest match based on my table calc "compute using" fields, which are in this case, day(date), month(date), quarter(date), year(date) (at the level of year(date).
any work around suggestions is much appreciated.
Robert,
DeleteThis is the exact concept I attempted to explain in the last paragraph of the post. The LOOKUP() function simply returns the value in the same place in another partition. It has no idea what that value corresponds to. If you want to alleviate your issue, you should fill in the missing dates.
Hope this helps,
Brad Llewellyn
Associate Consultant
Mariner, LLC
brad.llewellyn@mariner-usa.com
http://www.linkedin.com/in/bradllewellyn
http://breaking-bi.blogspot.com
what i did was create another field that returns the date of the row tableau is looking up. then compare that date to the current row's date. if it does not match, then return null. a hack, but it works. hope they add some sort of exact match lookup function in the future. thanks for the help!
ReplyDeletewhat i meant to write was "compare that date to the current row's date minus 1 year"
ReplyDeleteHi Brad,
ReplyDeleteInteresting post, is there a similar way one could calculate Quarter over Quarter growth using the Lookup function?
Any light on this would really help!
Thanks,
Aishwarya
Aishwarya,
DeleteIn the first part of the post, you see how the grain of the table is by Year? Just change that to by Quarter and Year, and the answer should fall out.
Thanks,
Brad Llewellyn
Associate Consultant
Mariner, LLC
brad.llewellyn@mariner-usa.com
http://www.linkedin.com/in/bradllewellyn
http://breaking-bi.blogspot.com
Ah, that did not strike me! Thanks a lot for the quick reply!
ReplyDeleteRegards,
Aishwarya
Incredible quest there. What occurred after? Good luck!
ReplyDeletemy web blog :: canadian web hosting
Hi Brad,
ReplyDeleteI want to lookup a value in the preceding column instead of the preceding row. Is that possible? If so, can you explain how?
Thanks
Vamsi
That depends on what the preceding column is. What is on your columns shelf? Is it a dimension? Is it Measure Names? Is it a measure?
DeleteHi ... ALL
ReplyDeleteI have a filed "Code" which contains data like "Paul10980" , how can i show only number data from that data in my report , how can we do it in Tableau.
Could you plz help me ........
That would depend greatly on what kind of values appear in that field. I recommend that you post this question at
Deletehttp://community.tableausoftware.com/welcome
Someone there might know a trick to help you.
Hi Brad
ReplyDeleteI am in situation to find out the first non null value in a Table and I came up with a formula lookup(zn(sum([Price])),first()+2) where my third value in the table is the first non null value. But I want the formula to dynamically build it rather than me mentioning the row which has non null value.
Is there any way to achieve it , Thanks your help is appreciated
Vishwakar,
DeleteThanks for commenting! Your question is actually quite intriguing and the answer depends on how your data and the table are structured. Any chance you could send me a mock-up or .twbx file?
Thanks!
Link to the dashboard
ReplyDeletehttp://public.tableausoftware.com/views/trial_12/Sheet1?amp;:embed=y&:display_count=no
I calculated the First Non-Empty value using the following table calculation
DeleteLOOKUP( SUM( [Price] ),
WINDOW_MIN(
IF NOT ISNULL( SUM( [Price] ) ) THEN INDEX() END
)
- INDEX()
)
Brad,
DeleteGreat site. Above table calculation finds the first non-empty value. How would you modify it to find the last non-empty value?
P.S. Love the Aggregator calculation!
Ross A. LeGrande
Ross,
DeleteCheck out this post
http://breaking-bi.blogspot.com/2014/04/calculating-first-and-last-non-empty-in.html
Thanks!
Brad,
DeleteGot it.
Once again, thanks.
Ross
yeah that works , Thanks Brad
ReplyDeleteCan you explain me the use of - Index() and what role it plays in the calculation.
Thanks for your Help , Appreciated .
Vishwakar,
DeleteThe LOOKUP() function looks up values in another place on the chart. However, it looks RELATIVE to the current position, not the absolute position. Here's an example.
You are in Row 3, i.e. INDEX() = 3. You want to look up the value in Row 2. Therefore, you are looking 1 row BACK. So, you need to do LOOKUP( [Value], -1). To put this in perspective, you need to do LOOKUP( [Value], [Row You Want] - INDEX() ). Hint: 2 - 3 = -1.
Hope this helps!
Great post Brad - and I realise it's a little old now.
DeleteAny thoughts on how to retain the wider indexing when action filtered down to specific subgroups that don't have data in recent dates? The lack of data causes the index to be shorter!
Thanks Brad
ReplyDeleteThat helps :)
perhaps you can provide some insight to this question on the tableau forums as it seems like a similar issue?http://community.tableausoftware.com/message/264990#264990
ReplyDeleteThere is a question where LOOKUP is doing odd things that seems like is on this theme ..
ReplyDeletehttp://community.tableausoftware.com/thread/142867
Hi Brad,
ReplyDeleteReally helpful post, thanks.
I have used the concepts in here to look at the current weeks sales vs. last weeks sales.
In this table I want to be able to select a particular week and see the current vs. previous week, however, if I filter on date I lose the previous weeks data as there is nothing in the table to look up (if that makes sense).
Is there anyway I can filter by a date range and still have the previous weeks data showing?
Thanks,
Matt
Thanks for commenting! The technique you are looking for can be accomplished in a couple of ways. I have another post about it here
Deletehttp://breaking-bi.blogspot.com/2013/03/creating-table-calculations-on-values.html
Thanks Brad - much appreciated!
DeleteMatt
Hi Brad
ReplyDeleteThank you very much for your explanation.
I want to create a calculated field that update sales every 6 months start from the current month forward.
More thanks
Fundy
Fundy,
DeleteI'm not quite sure what you mean. Are you saying you want to see your sales starting from this month until 6 months from now? Would something like
WINDOW_SUM( SUM( [Sales] ), 0, 5 )
work?
Hi Brad,
ReplyDeleteThanks for the interesting posts.
Is it possible to show the previous quarter value till the next quarter?
I have a report to show SLA status on a daily/monthly basis. there are few jobs which sla to be calculated only on quarter end. We have to show the previous quarter sla value till the next quarter end. For eg. if today is Mar 31 then we will calculate the sla and show. then if its Apr 1st and so on we have to show the Mar 31 value till June 30th. can you pls show some light on this..
I have the below columns and the sla calcualated based and end time.
Date Start_TIme End_Time
Karthik,
DeleteThanks for commenting! There are a couple of options for this depending on your specific issue. I mocked up a simple example using the following
Relative Date Filter: Last 100 Days (little more than 1 full quarter)
Quarter End Filter: Filters to only show the last day of each quarter.
I used the following calculation for Quarter End:
IF MONTH( [Order Date] ) = 3 AND DAY( [Order Date] ) = 31 THEN 1
ELSEIF MONTH( [Order Date] ) = 6 AND DAY( [Order Date] ) = 30 THEN 1
ELSEIF MONTH( [Order Date] ) = 9 AND DAY( [Order Date] ) = 30 THEN 1
ELSEIF MONTH( [Order Date] ) = 12 AND DAY( [Order Date] ) = 31 THEN 1
END
If you have different quarter ends, you can change them here or you could blend in a data source.
Finally, there are some cases where two quarter ends are within the 100 day window. So, I used a LAST() = 0 filter to only choose the most recent one.
Does this help?
Hi Brad!
ReplyDeleteThank you so much for the posts, and the advice! (so many of my questions were silenced before appearing!), but may you also have a hint (sorry if i missed it somewhere) - how could I only show Clients' records (= purchases) with the latest "Active" status (this status is by "service", or by purchase).
Such as, if 1 Client may have 2 "Active" statuses (Active and Cancelled), and I see that the "renew date" for the service(=purchase) listed as "Active" is later (and is hopefully in the future from now) than the date for the service associated with the service with the status "Canceled" - so I would like to associate this (most recent -> Active) status with the Client (who has canceled some services, but added or retained others).
So I first made a table with all Clients, their Statuses (stata?), and MAX(renewdate), now I can see clearly if in fact a Client is Active or Cancelled, by date, but how could I just leave the statuses associated with most recent renew dates? (to have 1 status per Client, because otherwise they are duplicated..), I tried a couple of filters similar to what you explained above, but still I would have at least 1 date PER status, whereas I was hoping to have ONE status per Client (this must be another calculation/filter altogether). Thank you very much in any case! (please let me know too, if this is not very clear).
Maria
Maria,
DeleteThanks for reaching out. It seems that you got ALMOST the whole way there. From your explanation, it seems that the last type of filter you need is INDEX() = 1. This is a table calculation that returns true if the row (as seen on the Tableau visualization) is the first one. So, all you need to do is assign the appropriate compute using and you should be set. If you're unaware of how to use Compute Using. Check out this post.
http://breaking-bi.blogspot.com/2013/07/introduction-to-table-calculations.html
Omg, it worked! Thank you so much!
ReplyDeleteNow i have:
Client ID | Active (status) | Most recent renew date (my calculated INDEX()=1 value) | Latest renew date - I chose "calculate by - "Active" status), and I can now filter our all FALSEs, which gives me an Active/Cancelled status by Client!
Thank you very much.
Haha! Now you're getting it. Good luck.
DeleteI wanted to use this look-up for a month calculation. For eg if i select in filter the month as January, the dashboard should show the data for months beyond January.
ReplyDeleteVibin,
DeleteThanks for commenting! That's a pretty common issue and the approach depends on your goal. Could you explain a little further what the chart is supposed to look like and how it should function?
Hi Brad .. interesting post. I was searching for kind of a rolling count and stumbled upon this article.
ReplyDeleteI need to count distinct users active in the last 5 days. Active users are defined as users that have atleast one signal data in the last 5 days. I need to create this data on a day by day basis. To me it seems like a database side fix, but is there something you can advice on Tableau?
The table structure looks somewhat as below -
USER SIGNALTIME
----- ---------------
100 2014-07-29 12:15:00
100 2014-07-29 12:45:00
101 2014-08-05 12:24:00
100 2014-08-06 12:24:00
103 2014-08-07 12:25:00
Thanks,
Mayank
Mayank,
DeleteThanks for commenting. The issue you are describing is quite a complex one. Let me ask you one question first. Are you trying to create a single value that is Distinct Count of Users in the 5 days previous to Today? Or, are you trying to create a chart that shows the Distinct Count of Users within 5 Days for EVERY day (not just today)? Does this make sense?
Hi Brad,
ReplyDeleteGreat posts!
I am currently struggling with comparing 2014 and 2013 daily delivery. Using a line graph I need to display how we delivered on a particular day in 2013 and in 2014. Tableau does enable monthly comparison, but I cannot get it to display day and month comparison.
I'm envisioning x-axis displaying day number and month, starting with December 1, and having years as color coded lines. Any suggestions on this?
Thanks a lot in advance!
Kate,
DeleteI apologize for my delayed response. It's been a hectic month. What you're asking for should be easily accomplished by adding 2 pills to your Columns Shelf. The first pill will be MONTH( [Date] ) and the second pill will be DAY( [Date] ). Then, you would put SUM( [Delivered] ) on the Rows Shelf. Finally, you would add YEAR( [Date] ) to the Colors Shelf. Does this make sense?
I've a customer level data with fields like location, region, purchase made flag with values 1 & 0. Now I want to derive a field (ratio) on a monthly basis which is sum(purchase made flag) / total customers of previous month.
ReplyDeleteI'm using the LOOKUP function in tableau and have created a formula which is
sum(Purchase made flag) / LOOKUP (count[customer]), -1). The formula works fine when I put MONTH variable in row but whenever I choose a new dimension (e.g. region) the values are derived as per that dimension. Also, if I select only one value of MONTH (in filter), the value comes out to be blank.
Is there a way in tableau to calculate the above field only through the MONTH dimension. Once the value is derived I want to use other variables as filters or i BAR/circle graphs.
So lets suppose, the Ratio figure for Mar is 25%, so I'll use country and show how this 25% is distributed across different countries for Mar.
I want to replace Null values with N/A,can you please help me in this,as far as i know we need to create a calculated field using IFNULL,.what is the exact command?
ReplyDeleteAwesome Post Brad .. v Helpful .. thanks :)
ReplyDeleteHi, I have a doubt.I have a column called retailers and I have pulled it in my columns.I have a sales column.when I pull it, I get sales across all the retailers.Now I want sales across all the retailers with respect to just the first retailer.That is by how much they are more or less wrt to first retailer in the view.
ReplyDeleteHi Brad,
ReplyDeleteAwesome Post
How you mixed up the Quarters, I mixed up the Quarters on month basis so that each quarter has non repeating month but i didn't get the result...
Please Help me Out
For order management data in Tableau, a calculation between columns plus rows is to be done. I'm trying to bring up all the observations in Tableau (a row represents a single order identified by order id) to show orders which are potentially rebooked.
ReplyDeleteThe rule is that if for cancelled orders by a specific customer for a specific product type are placed again within a week, then they are potentially rebooked. For this, difference between order closing date for any cancelled order and order creation date for a fulfilled order are to be calculated if they are by same customer for same product type.
So, a calculation between columns (order closing date and order creation date) has to be done between rows (cancelled and fulfilled order if customer and product type are same).
Every row represents a unique order and has an order id, customer, product type, cancelled or non cancelled code, order entry date and order closing date. How can this be done in Tableau?
Hi Brad,
ReplyDeleteCongrats on the site: it's very helpful!
Maybe you can help me on this issue... I need to display last year's sales value for today's month. By creating a lookup calculated field, I get the figure I need for all months. But I only want to display (and calculate comparison values) for today's month. And, of course, using a date filter breaks my lookup (if I display only current month, then 12-month-ago data are not available to be looked up)...
I've thought about using "Fixed" level-of-details, but then, I couldn't find any compatible "lookup" function.
Any idea?
Hi Brad,
ReplyDeleteDisplay Last Week Sales of each and every country for every month in the form of a map. Restart every Month.
Hi, thank you for this post. very helpful. have question. I got last year value with this year value but when I filter year as current year, last year field shows null. anyway I can keep last year value by filtering to current year?
ReplyDeleteHello,
ReplyDeleteI am trying to figure out what to do if I have to lookup an account number during a time span of a month and see if its repeated. So if I have an account number on july 1 2016, I have to find if its repeated during the 28 days prior to july 1.
Thanks to anyone that could help me.
I have columns that are labeled as follows: 1, 2, 3, 4, 5, 6, 12
ReplyDeleteI then have to cost amounts in the rows. I am trying to make one of those cost amounts to shift one to the right.
The problem is that the number in 12 disappears. I have tried:
LOOKUP([cost], -1) as well I have tried
IF Period = 12 THEN LOOKUP([cost],6) ELSE LOOKUP([cost],-1) END This did not work for me either, because it ended up making the column 12 cost disappear.
Any help please?
An way to do this WITHOUT a time series pill? Just in filter
ReplyDeleteHi , I have a situation where using custom SQL I have got the data from two tabs. Now I have to get the count of those rows which matches from one tab to other . Will I be able to use lookup function
ReplyDeleteHello Brad,
ReplyDeleteI want to display the previous year vs current year records,growth,lose everything.I am in situation where i select the particular year that year shows the all records as well as previous records also and show there is growth or lose.Is this things is possible by lookup.how we achive this things.Thanks your help is appreciated
Good day! I could have sworn I've been to this
ReplyDeletewebsite before but after reading through some of the post I realized
it's new to me. Nonetheless, I'm definitely glad I found it and I'll be book-marking and checking back often!
Hi Can someone help me on finding the greater measure among two columns. i have a formula for row wise written,need for Column wise formula
ReplyDeleteRow wise calculation for color coding :
lookup(SUM([Profit]),0)>lookup(Sum([Profit]),1)
Hi
ReplyDeleteWhat if you want the value in to return multiple values. I am trying to figure out a financial heirarchy and one value = 4 values to give me a accurate total. Apologies for non-technical description. I am still learning.
Connie