Today, we will talk about creating table calculations for values that are being filtered out of your view in Tableau. A common scenario for this is as follows: "I want to see this month's sales as well as a 12-month rolling average for last year." Let's naively put this is a chart. As usual, we will use the Superstore Sales sample data set in Tableau.
Step 1:
- Create a 12-Month Rolling Average
- Create the following calculated field
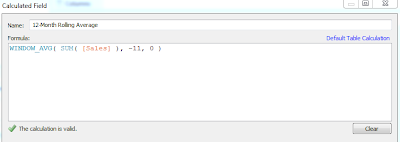 |
| 12-Month Rolling Average |
We will use this calculation throughout this post, so don't go deleting it or creating a new workbook.
Step 2:
- Drag Month to Columns Shelf
- Drag Sales and 12-Month Rolling Average to the Rows Shelf
- Turn on Dual Axis and Synchronize the Axes
- Turn Sales into bars and 12-Month Rolling Average into a line
- Filter the year to be 2012
 |
| Naive Rolling Average |
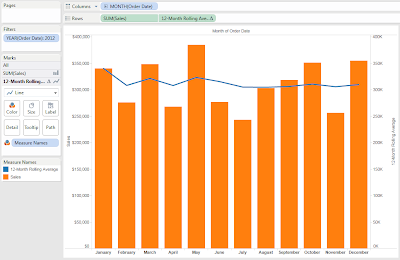
There are two very important things to notice about this "Rolling Average." To start, the first value in the line is exactly the first month's sales. Also, the line gets more and more stable as we progress in time. This is because our rolling average doesn't consider any values outside of our filter. The only value that is a true 12-month rolling average is the value for December.
We can fix this by exploiting the order in which operations are performed in Tableau. We want our table calculations to be evaluated before the data is filtered on year. We know that Tableau executes all table calculations simultaneously. Therefore, if we can use a table calculation to filter on year, then we will force Tableau to evaluate our table calculations before it filters on year. Let's do this.
Step 1:
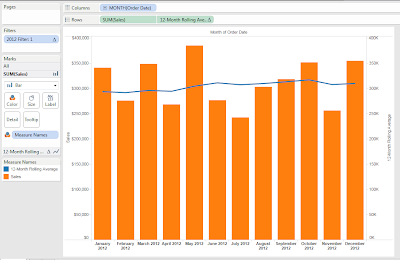
- Examine the structure of the graph without a date filter
 |
| Unfiltered graph |
Using this graph, we want to hide the first 36 bars (months) and show the last 12 bars (months). There are many ways to do this; we will use the INDEX() function because it seems to be the most intuitive in this situation.
Step 2:
- Create the following calculated field
 |
| 2012 Filter |
Step 3:
- Make "2012 Filter" Discrete
- Filter "2012 Filter" to be 1
 |
| True Rolling Average |
Notice that the line is much smoother the entire way across the graph, indicating that it is evaluated properly. There is no simple answer to this problem when you encounter it in your work. You must be able to create your own clever table calculation depending on how your data looks. Remember, there are plenty of table calculations to help with this, such as FIRST(), LAST(), or even WINDOW_SUM(). Depending on your situation, you may even be able to use the Pages Shelf. I hope you found this informative. Thanks for reading.
EDIT:
Joe Mako commented with the more elegant method of using LOOKUP( MIN( YEAR( [Order Date] ) ), 0 ) instead of the index on the months. This just goes to show that there are many different ways to handle this situation. Many thanks to him and all of the readers.
Brad Llewellyn
Associate Consultant
Mariner, LLC
llewellyn.wb@gmail.com
https://www.linkedin.com/in/bradllewellyn


This was exactly what I needed to drive my calculations based on most current month! Thank you!
ReplyDeleteGlad I could help. If you find any other situations that you can't seem to solve, or find a clever solution. Let me know so that we can spread the word. Enjoy!
DeleteAnother option that may be more intuitive than filtering on Index is to filter on a calc field like:
ReplyDeleteLOOKUP(MIN(YEAR([Order Date])),0)
keeping only the year that you want.
No matter how much I learn, you always seem to teach me something new. Thanks :D
DeleteIntuitively what is this calc doing? Also, is there a way to incorporate this with another year filter? For example, if I want to filter every sheet on a dashboard to only show 2015 data, but I want to compare year-over-year on a specific sheet (i.e see both 2015 and 2014)?
DeleteHey my data has both TY and LY figures. I want to use the index function only on TY figures and display top 5 dynamically (both TY and LY number for which TY falls in top 5 segment) based on a selection in paramater. However, index function is ranking Ly and Ty numbers separately and so some fields come up wher LY has rank lesser than or equal to 5. Is it possible to use index function conditionally on only TY numbers?
ReplyDeleteThanks for commenting! Please check out the following link, it should help.
Deletehttp://www.speedyshare.com/ZbcAc/Top-5-This-Year.twbx
This is a simple mock-up of what I understand your question to be. Let me know if this helps!
How do i display the Running Total calculation for last 12 months Irrespective of year eg: apr 2013 - apr 2014.
ReplyDeletePerhaps I'm misunderstanding but that's precisely what I do in the post.
DeleteI'm really new to Tableau and I really thank You, for such a good blog. As I am new I didn't figured out, how this LOOKUP( MIN( YEAR( [Order Date] ) ), 0 ) could be used instead. How exactly?
ReplyDeleteAnd in your other post you write "The LOOKUP() function allows you to find values that exist elsewhere in your table, or not in the table at all" Do you know example, where LOOKUP is used to find values that are not in the table at all?
Thank you anyway :) You seem really good expert on Tableau
If you create a calculated field for
DeleteLOOKUP( MIN( YEAR( [Order Date] ) ), 0 )
You can drag it onto the filters and filter for the year you want. Your second question is a little more complex. However, the technique in this post shows you how to use window_sum to look at values that you can't see (i.e. not in the year window you are looking at).
Hi Brad, Great post. Do you have experience creating graphs that display the current and historical average WITHIN a category rather than across categories? This seems simple but I can't find a way of calculating this in Tableau...
ReplyDeleteThanks for commenting! This is where "Compute Using" comes in. You can refer to this post for information on how to use "Compute Using".
Deletehttp://breaking-bi.blogspot.com/2013/07/introduction-to-table-calculations.html
Thank you!
ReplyDeleteHi, I am hoping to be able to get some help on a similar issue I have where I need to do calculations on values outside of the filter results.
ReplyDeleteI have MY(Date) on the filter shelf and the resulting table will show all the values for the different variables for the selected month. I need an additional column to show the % difference from the selected month and the previous month for a particular variable. I am having some problems trying to apply the solution to my context and will appreciate any help!
Thank you so much!
Thanks Brad - is there a way of defining that number (36) by a parameter? By that I mean, I have a date, after which I want to see the data. I don't know the index of that date. Can I calculate the index of the date or is there any other table calculation function that can help me get the right data for my view? IE, the parameter will say 2012,2013 etc and the data is going to be filtered accordingly.
ReplyDeleteThank you
Hey, Awesome post!
ReplyDeleteMy data has fields: Date Purchased, Country Tickets_Purchased, MyTickets, Others Tickets, Total Tickets sold
I have created calculated fields to compare last week sales to this week sale % using DATEDIFF.
Now when I pull Country to filters and filter desired country the % shows 0.00000%.
Please help me tackling this problem.
hi
ReplyDeletei have a parameter which has category values. i want to show for each category , only its sub-categories sales percentage in pie chart. can you help me?
Hi
ReplyDeleteI have a very doubt in Whiskars plot,would you suggest to post a simple example of Whiskars Plot
Hi Brad,
ReplyDeleteGreat stuff! really Helpful
I have a follow up question on the 12-Month Rolling Average.
I want to see the "AVERAGE" of a rolling 12 Month SUM
See my example question below:
https://community.tableau.com/thread/211893
What's your approach on this?
Thanks in advance
Tharushi
Hi.
ReplyDeleteI tried using the LOOKUP function instead of INDEX. But the issue I'm facing is that when I place the calculated field on the filter shelf. When I show the filter, there is a value "#Missing" populating in the filter values. How do I solve this?
Excellent thankyou
ReplyDeleteI've had a go at using this for calculating This Year v Last year, and it appears to work. I have Order date, down to a month level and the Sum([Sales]) as the figure.
ReplyDeleteI want to be able to change the length of time to look at, so I created a Parameter to be able to change the '36' in the Index filter you've created. Which seems to work ok, but what if I want to aggregate it up so that I don't see the Years and Months listed?
Basically I want to see Total Sales and vLY set by the parameter of how many months I select. E.g. if today is 28th Feb, and the parameter is select as last 6 months, I want to see Total Sales from 1st Sep 2017 to 28th Feb 2018 and the vLY to show % difference compared to 1st Sep 2016 and 28th Feb 2017.
How would you go about this?
Thanks.
Hi Brad, is there any way I only display the value of the 12month rolling number only for the latest month or the month I select from a parameter of date. I am stuck with this for more than 5 days now.
ReplyDeleteBasically just wanted to show the value of the 12month rolling for any given month based on what I select through a parameter. Looking to hear from you