Today, we will talk about the "Pages" feature in Tableau. When you drag a field onto the "Pages" Pane, you get a separate graph for each value in the field. You can then cycle through the values to create a sort of slideshow on your graph. This is especially useful for showing how your data changes through time. As usual, we will use the Superstore Sales sample data set in Tableau.
Step 1:
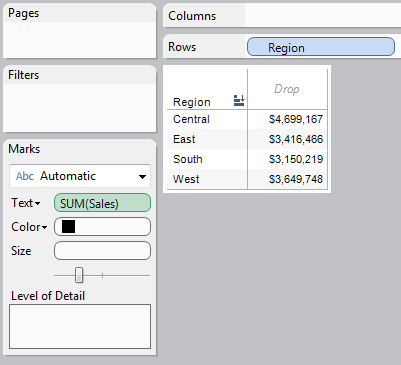
 |
| Sales by Region |
Step 2:
- Drag "Order Date" onto the "Pages" Pane
- Uncheck the "Show History" Box
.PNG) |
| Sales by Region (with Yearly Pages) |
While this is somewhat useful, it lacks any sense of history. What if you need to see how this year's values compare to last year's? "Pages" can do this as well.
Step 3:
- Keep "Order Date" In the "Pages" Pane
- In the "Page" Card (top-left where you select which year you want to look at), Check the "Show History" Box
- Add Another Instance of "Order Date" to the "Columns" Pane
.PNG) |
| Sales by Region and Year (with Yearly Pages) |
Now, you can see the previous values as well. One thing we haven't touched on yet is the ability to "Auto-Play" a set of pages. On the "Page" Card, you can click the "Play" Button (looks like a Right-Arrow) to cause the pages to cycle through on their own. You can alter the speed of the play by selecting on the boxes with the bars in them in the Bottom-Right corner of the "Pages" Card. Also, if you click on the arrow in the Top-Right corner of the "Page" Card, you can set whether the play will loop or not. So far, we've only been using text tables due to their simplicity; however, these tools can do so much more. I encourage you to play around with the "Pages" tool and see what kinds of interested visualizations you can create. Thanks for reading.
Brad Llewellyn
Associate Consultant
Mariner, LLC
llewellyn.wb@gmail.com
https://www.linkedin.com/in/bradllewellyn
.PNG)
.PNG)
No comments:
Post a Comment