Databricks is a managed Spark framework, similar to what we saw with HDInsight in the previous post. The major difference between the two technologies is that HDInsight is more of a managed provisioning service for Hadoop, while Databricks is more like a managed Spark platform. In other words, HDInsight is a good choice if we need the ability to manage the cluster ourselves, but don't want to deal with provisioning, while Databricks is a good choice when we simply want to have a Spark environment for running our code with little need for maintenance or management.
Azure Databricks is not a Microsoft product. It is owned and managed by the company Databricks and available in Azure and AWS. However, Databricks is a "first party offering" in Azure. This means that Microsoft offers the same level of support, functionality and integration as it would with any of its own products. You can read more about Azure Databricks here, here and here.
To get started with Azure Databricks, we need to create an account. We can do this in the Azure Portal.
 |
| Databricks Account Creation |
 |
| Launch Workspace |
 |
| Azure Databricks Portal |
 |
| New Cluster |
 |
| Cluster Definition |
 |
| New Notebook |
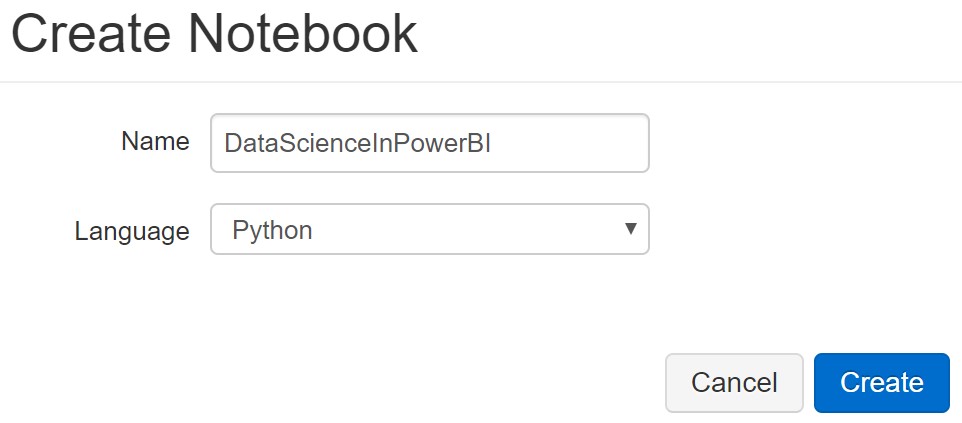 |
| Create Notebook |
 |
| Read Avro from Blob |
%scala
spark.conf.set(
"fs.azure.account.key.datascienceinpowerbibig.blob.core.windows.net", <Storage Account Access Key>
);
val df = spark.read.format("avro").load("wasbs://interactivequery@datascienceinpowerbibig.blob.core.windows.net/data");
df.show();
<CODE END>
We were able to do this in a few basic lines of code. Now that we can access our data, let's discuss the goal of this post. In the previous post, we mentioned that Hive doesn't perform well against lots of small files. This is true for Spark as well. One technique for handling this is to have jobs that coalesce a large number of small files into a single large file. These jobs can be run daily, weekly or monthly depending on the data needs of the organization. Since we've already stored the entire dataset in the "df" Data Frame, it's trivial write all of this out to a set of randomly partitioned files or a single file.
 |
| Write Avro to Blob |
%scala
// Write using default partitions
df.write.format("avro").save("wasbs://interactivequery@datascienceinpowerbibig.blob.core.windows.net/datadefault/")
// Write using single partition
df.repartition(1).write.format("avro").save("wasbs://interactivequery@datascienceinpowerbibig.blob.core.windows.net/datasinglefile/")
<CODE END>
Since Spark is a distributed processing framework, the default state is to read and write files in a partitioned state. However, we can overwrite this by using the "repartition()" function. Let's take a look at the results.
 |
| Default Partitions |
 |
| Single Partition |
Seeing this data leads us to two important questions. First, is the total data volume smaller if we store it in multiple files?
 |
| Storage Statistics |
 |
| Read Statistics |
Now that we've compiled all of our small files together, we need to expose the data in a way that Power BI can efficiently read. Power BI can read from Blob Storage, but it's messy and we won't try that. Fortunately, Databricks has a built-in Spark SQL Database that we can write our data to.
 |
| createOrReplaceTempView |
%scala
df.createOrReplaceTempView("Customers")
<CODE END>
<CODE START>
%sql
SELECT * FROM Customers LIMIT 10
<CODE END>
Databricks allows us to leverage a Scala function "createOrReplaceTempView()" that automatically creates a temporary table for us. Unlike in the previous post, this table is not connected directly to the data in blob storage. Instead, it's a copy of the data that is stored directly inside the Databricks DBFS Storage. Just like with HDInsight, it is possible to create an external table that connects to remote file storage. In order to do this, we must first mount the storage container.
 |
| Mount Storage Account |
%scala
dbutils.fs.mount(
source = "wasbs://interactivequery@datascienceinpowerbibig.blob.core.windows.net/datadefault",
mountPoint = "/mnt/datadefault",
extraConfigs = Map("fs.azure.account.key.datascienceinpowerbibig.blob.core.windows.net" -> <Storage Account Access Key>))
<CODE END>
This command allows us to access the data in the "datadefault" folder within the "interactivequery" container, simply by referencing the "/mnt/datadefault" location as if it was local. We can use this to create our external table. Understanding that it's not good practice to use your account keys in our code, it's also possible to store our Account Keys using the Secrets API and reference them using the "dbutils.secrets.get" function.
Unfortunately, while writing this, we discovered that there is a bug affecting the use of Avro for this operation. If we use the Avro data, we end up with a strange table.
 |
| CustomersBlob (Avro) |
%sql
CREATE EXTERNAL TABLE CustomersBlob(
customerid string,
age int,
workclass string,
fnlwgt int,
education string,
educationnum int,
maritalstatus string,
occupation string,
relationship string,
race string,
sex string,
capitalgain int,
capitalloss int,
hoursperweek int,
nativecountry string
)
STORED AS AVRO
LOCATION '/mnt/datadefault/';
SELECT * FROM CustomersBlob LIMIT 10;
<CODE END>
Fortunately, saving the same data in Parquet format resolves the problem with no issue.
 |
| CustomersBlob (Parquet) |
 |
| Customers |
Brad Llewellyn
Service Engineer - FastTrack for Azure
Microsoft
@BreakingBI
www.linkedin.com/in/bradllewellyn
llewellyn.wb@gmail.com
No comments:
Post a Comment