Today, we're going to talk about getting started with R scripts within Power BI. For the time being, this series will focus on utilizing R in different ways to enhance the analytical capabilities of Power BI. However, we may delve into the world of
Azure Machine Learning Services or
HDInsight later. If you haven't read the first
post in this series, it may provide some useful context. Let's move on to the core of this post, R scripts.
Power BI Desktop does not install R on our local machine. We have to do that part ourselves. We can find a link to install R
here.
 |
| Options |
Once we've done that, we open up Power BI. Then, we select "File -> Options and Settings -> Options".
 |
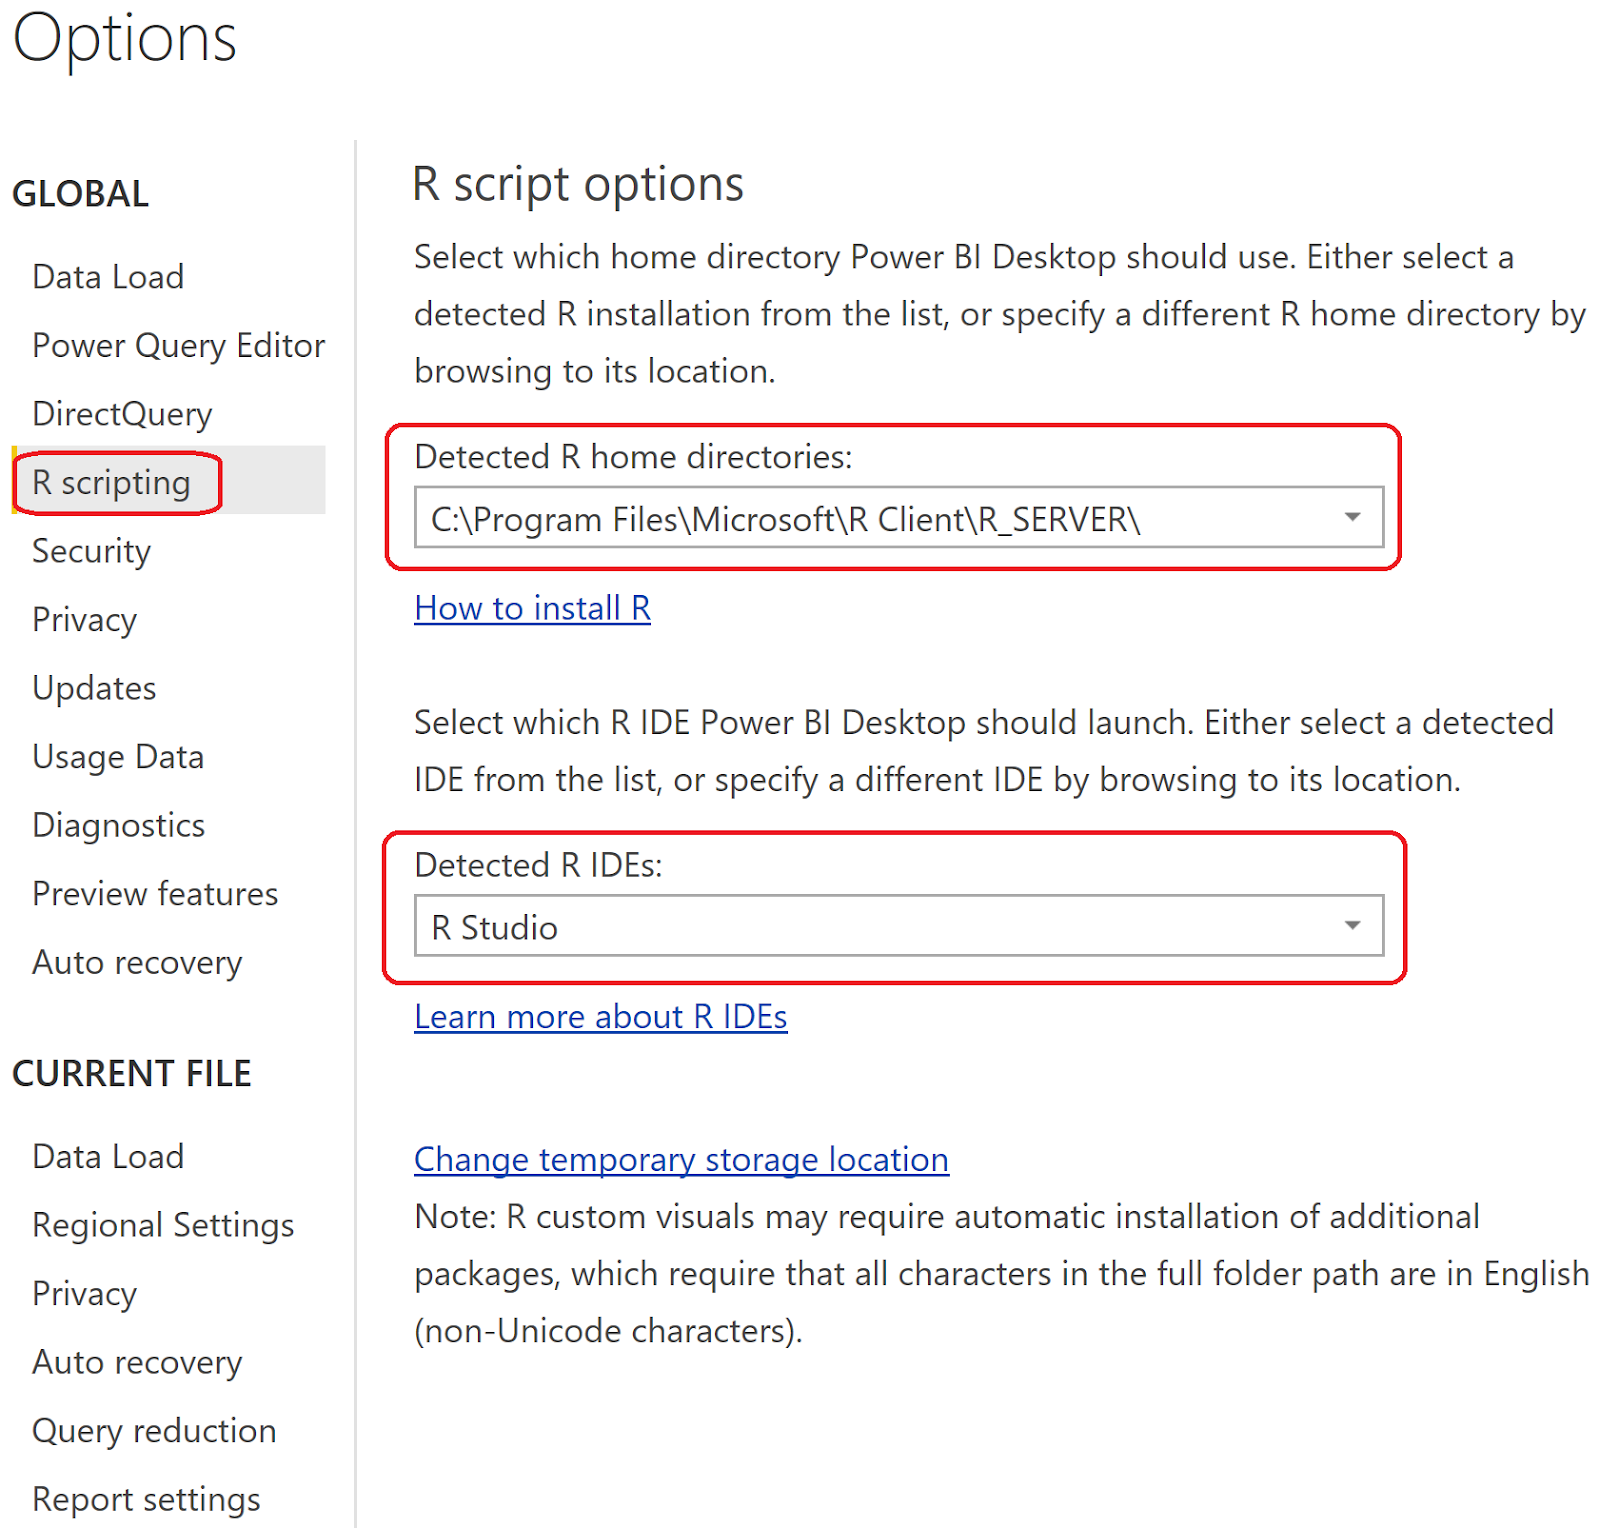
| R Scripting |
In the "Options" window, select the "R Scripting" tab. In this tab, we need to select the location of our R installation, as well as the IDE we will use to write our R code. The R installation location is crucial. We decided to use the same installation as we use for RStudio. This ensures that we don't run into any issues of code running differently between RStudio and Power BI.
For those that aren't aware of RStudio, it's a great (and free!) tool for developing R code, regardless of whether that code goes into Power BI or any other application we you may be using. If you have never used it, you can download it
here.
 |
| RStudio |
In RStudio, we can confirm the location of our R Installation by selecting "Tools -> Global Options...".
 |
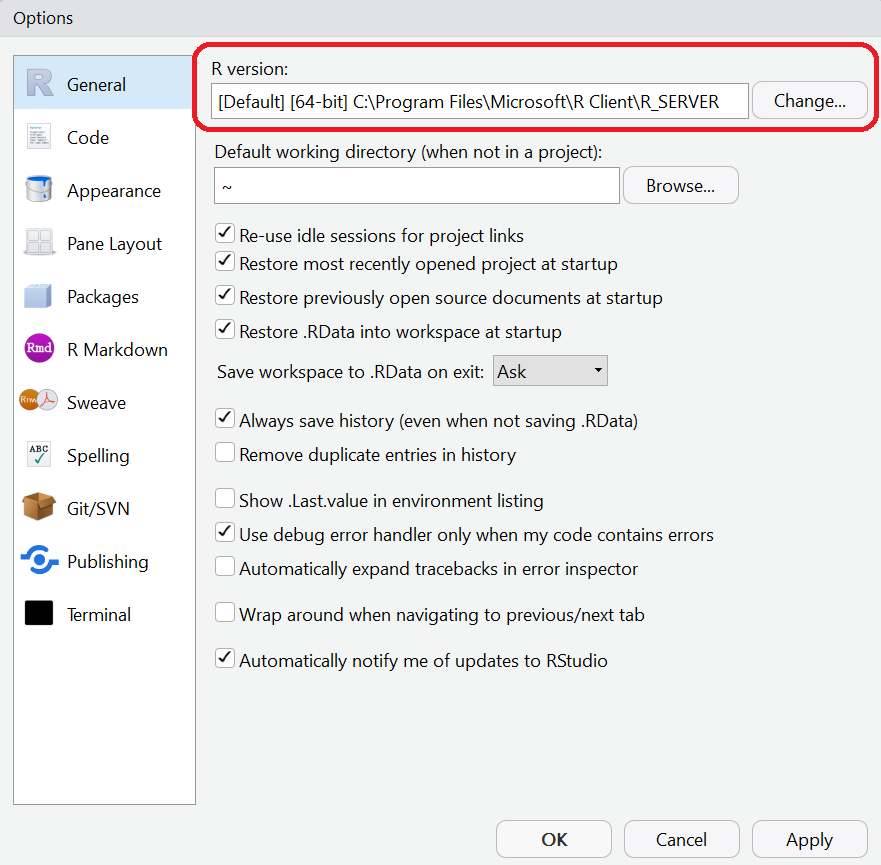
| RStudio Options |
After we confirm that Power BI and RStudio are using the same installation of R, we also confirm that RStudio is listed as the default IDE for developing R code within Power BI.
Now that we've ensured Power BI and RStudio are pointing the same location, let's test it out. You can find a link to the Customer Profitability Sample PBIX
here.
 |
| Revenue by YearPeriod |
In this PBIX, we can create a new tab and create a line graph of Revenue by YearPeriod. Now, let's try to recreate this chart using an R Visual.
 |
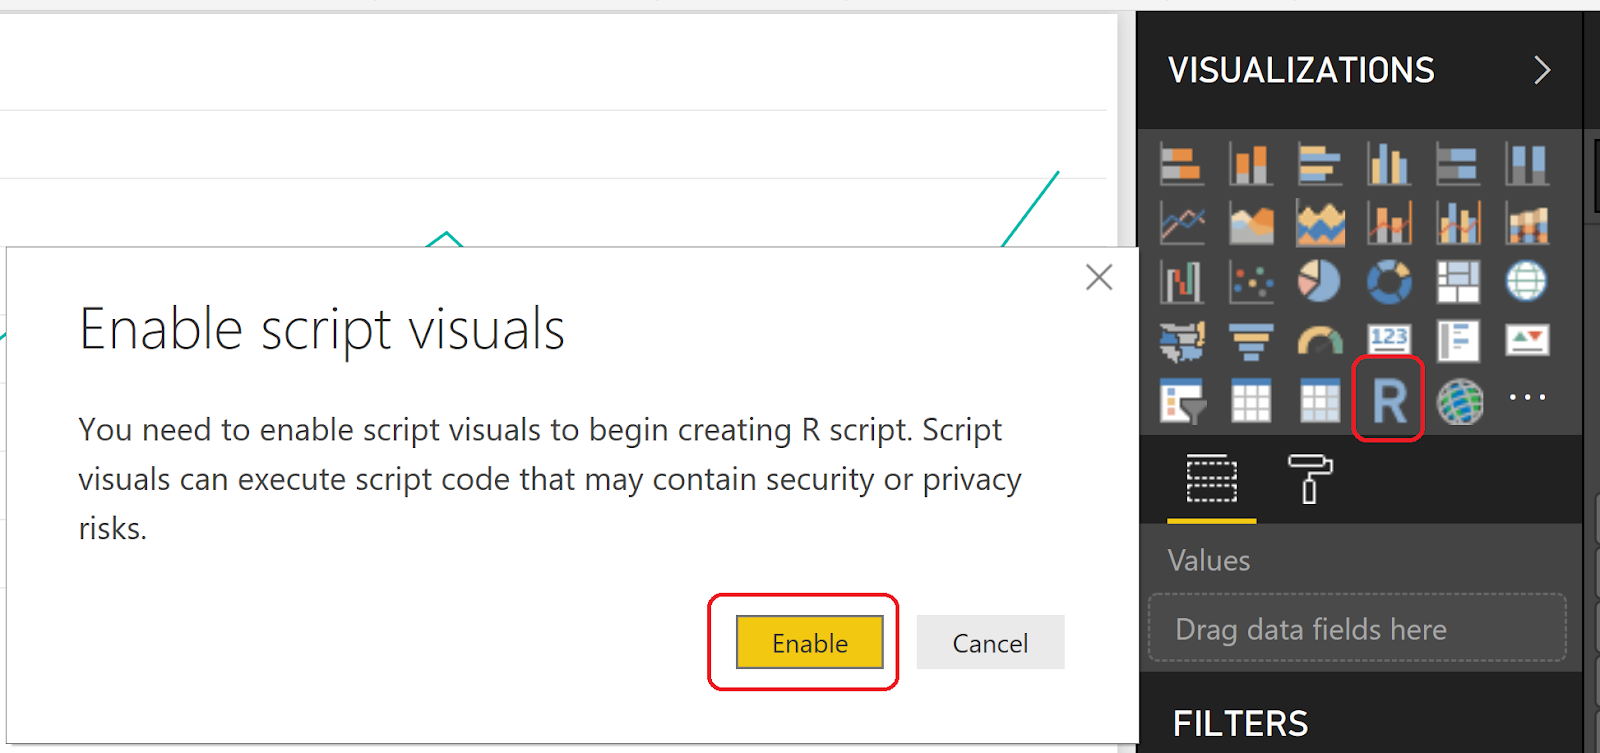
| Enable Script Visuals |
First, we select "R Script Visual" from the "Visualizations" pane. If this is your first time creating an "R Script Visual", you may need to enable script visuals by selecting the "Enabling" option.
 |
| R Script Editor |
This should cause the "R Script Editor" window to appear at the bottom of the screen. In order to create an R script, we first need to provide some fields from our dataset. Just like before, let's provide the [YearPeriod] field and [Sum of Revenue] measure.
 |
| R Script with Data |
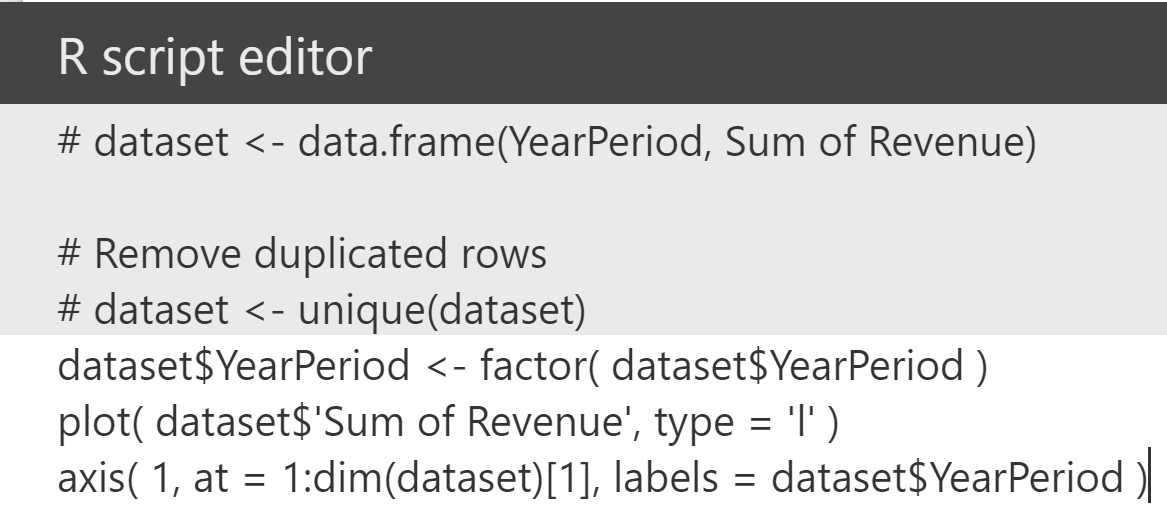
Once we've added our fields to the "Values" pane, the R Script Editor automatically supplies us with a starter script for pulling in the data. It's important to note that we can't alter the way the data is pulled in. Any alterations we want to make will have to be done on the data itself in Power BI or after the data is loaded into R. Let's try to remake our line graph using the following code:
<CODE START>
dataset$YearPeriod <- factor( dataset$YearPeriod )
plot( dataset$'Sum of Revenue', type = 'l' )
axis( 1, at = 1:dim(dataset)[1], labels = dataset$YearPeriod )
<CODE END>
 |
| Complete R Script |
 |
| Complete R Visual |
We can see the charts match exactly, minus a few scaling and labelling differences. However, this shows us that our R scripts are successfully running and can be used to create all kinds of new fun visuals. Hopefully, this post broadened your horizons a little bit by showing the capability of utilizing R code within Power BI. It is a very powerful capability that we will continue to showcase in interesting ways. Stay tuned for the next post where we'll talk about Clustering in Power BI. Thanks for reading. We hope you found this informative.
Brad Llewellyn
Senior Analytics Associate - Data Science
Syntelli Solutions
@BreakingBI
www.linkedin.com/in/bradllewellyn
llewellyn.wb@gmail.com


No comments:
Post a Comment