This post is going to build directly on what we created in the two previous posts, Azure Machine Learning Studio and Stream Analytics. As such, we recommend that you read them before proceeding.
In our previous post on Azure Machine Learning Studio, we built a basic predictive model that predicts the income of new customers based on their demographic information. This predictive model is currently exposed to us as a web service. In the previous post on Stream Analytics, we built a basic data stream of new customers to show how the Power BI Service can be leveraged to visualize streaming data. Obviously, the next step here is to combine these two features to create a data stream that predicts Income in real-time. We start by opening up our existing Stream Analytics query in the Azure Portal.
 |
| Stream Analytics Query |
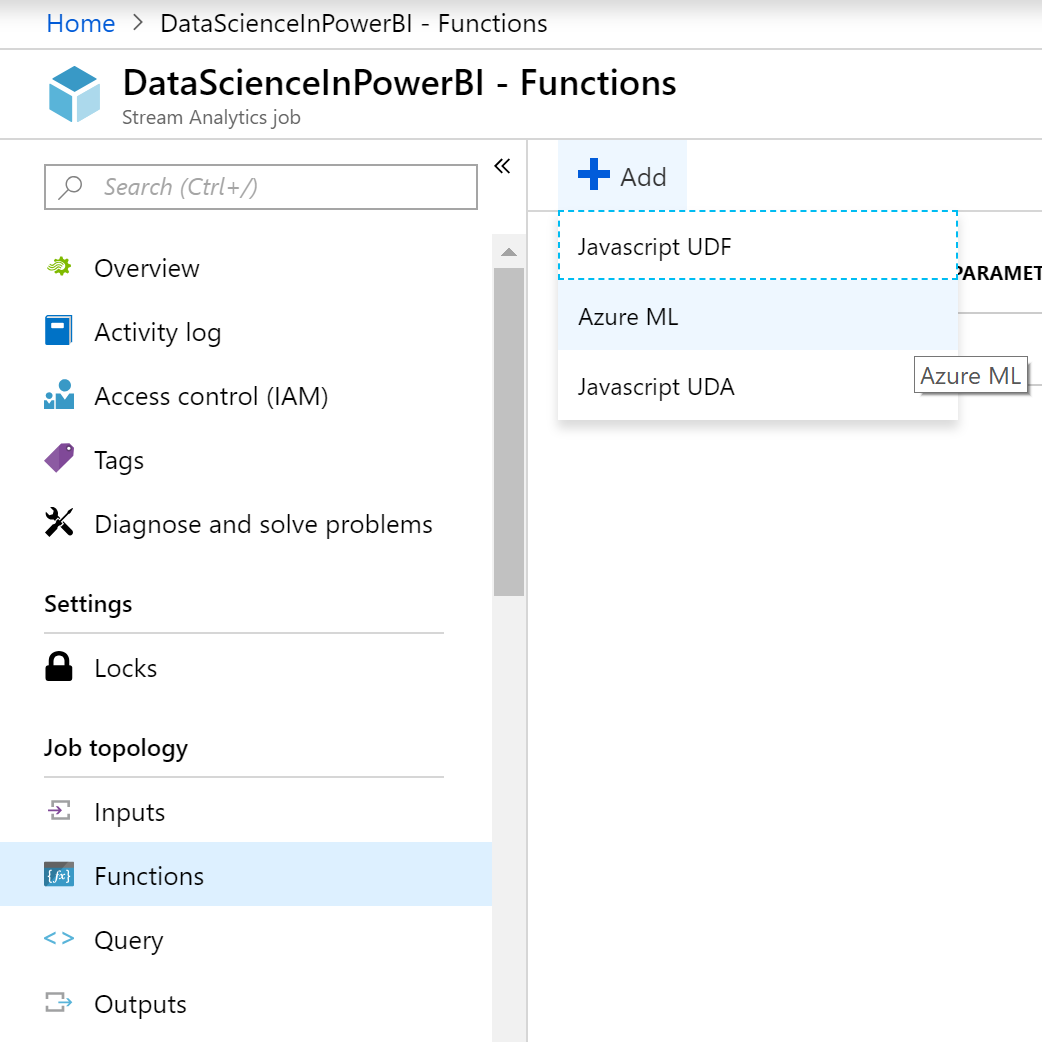 |
| Create Azure ML Function |
 |
| DataScienceInPowerBI Function |
 |
| Function Details |
 |
| Updated Query |
WITH T AS (
SELECT *
,DataScienceInPowerBI(
1, [age], [workclass], [fnlwgt], [education], [education-num]
,[marital-status], [occupation], [relationship], [race], [sex]
,[capital-gain], [capital-loss], [hours-per-week], [native-country]
,''
) AS [PredictedIncomeRecord]
FROM [CustomersSASource]
)
SELECT *
,[PredictedIncomeRecord].[Scored Labels] AS PredictedIncome
,[PredictedIncomeRecord].[Scored Probabilities] AS ScoredProbability
INTO [CustomersStream]
FROM T
<CODE END>
As it turns out, the "DataScienceInPowerBI" function returns a value of type "record". This means that we can't simply call the function and pass the results to Power BI. So, we needed to make a CTE to capture the result in the "PredictedIncomeRecord" field. Then, we pulled out the "Scored Labels" and "Scored Probabilities" fields in the final SQL statement. It's important to note that we hard-coded 1 and '' (empty string) into the function call as our values for "id" and "income", as these fields do not exist in our data stream. As we mentioned earlier, these fields should typically be removed in production scenarios.
As a side note, testing functions can be very difficult in Stream Analytics if you are using a Power BI sink output. As we were developing this, we used a temporary blob storage container as our output sink, which allowed us to see the results of our queries in raw JSON format. This is the recommended approach when developing more complex Stream Analytics queries.
Finally, let's clean up from our previous runs and start the stream with fresh data. This will give us a dashboard that shows real-time streaming predictions.
 |
| Streaming Dashboard with Predictions |
Brad Llewellyn
Service Engineer - FastTrack for Azure
Microsoft
@BreakingBI
www.linkedin.com/in/bradllewellyn
llewellyn.wb@gmail.com
No comments:
Post a Comment