First, let's look at the TOTAL() function. The TOTAL() function applies the underlying aggregation to the entire pane instead of each individual row.
Step 1:
- Create a text table with two hierarchical dimensions on the rows
 |
| Sales by Sub-Category |
- Calculate the total sales across all categories
- Calculate the total sales for each category
- Create the following calculated fields
 |
| Category Total |
 |
| Overall Total |
Take care to notice what values are being summarized over.
Step 3:
- Add these values to the table
.PNG) |
| Sales by Sub-Category (with Totals) |
This example is somewhat silly because this is much better accomplished by adding Row Subtotals. However, this is a great example to show how the TOTAL() function works.
Now, let's move on to Window Calculations. We will use WINDOW_SUM(); however, the same techniques can be applied for the other Window Calculations as well. A Window Calculation requires three input parameters. These parameters are an aggregated value, a displacement value for the starting point, and a displacement value for the ending point. For example,
WINDOW_SUM( SUM( [Sales] ), 0, 0 )
will calculate the SUM of SUM of [Sales] for the current row only, which is just the SUM of [Sales]; whereas
WINDOW_SUM( SUM( [Sales] ), FIRST(), LAST() ) or just WINDOW_SUM( SUM( [Sales] ) )
will calculate the SUM of SUM of [Sales] for the entire pane, which is identical to using
TOTAL( SUM( [Sales] ) ).
Step 1:
- Create a text table
 |
| Sales by Sub-Category |
Step 2:
- Calculate the sum of each Sub-Category along with the previous and next Sub-Category
- Create the following calculated field
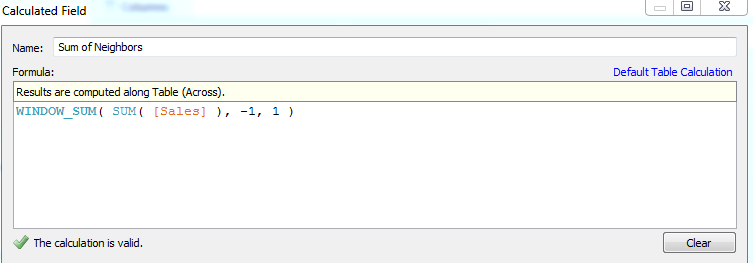 |
| Sum of Neighbors |
Step 3:
- Add this value to the table
.PNG) |
| Sales by Sub-Category (with Sum of Neighbors) |
Now, you can see that each value is the Sum of [Sales] for this Sub-Category as well as the two neighboring Sub-Categories. Care should be taken to avoid situations such as the first as last row, where there is no previous or next value, respectively.
There is so much more to be done here. Try combining Window Calculations with different aggregrations, such as Sums of Averages, or try creating your own Percent of Total calculations. I hope you found this informative. Thanks for reading.
Brad Llewellyn
Associate Consultant
Mariner, LLC
llewellyn.wb@gmail.com
https://www.linkedin.com/in/bradllewellyn
https://www.linkedin.com/in/bradllewellyn
Hi
ReplyDeleteThis looks like a great approach - however when i duplicate the effort with multiple extra dimension the figures does no longer summarize per category but per line only.
Have you any experience with this?
Thanks in advance
Christian
I replicate this and got the same results but many of the sum of neighbors are correct. Ex. Copiers, Office Machines, Telephones are correct. Whereas Chairs, Tables, Appliances are incorrect.
ReplyDeleteHi Brad,
ReplyDeleteI donthave the "container" dimension in my excel , which excel can i get it.
Hi Brad, nice post. I have similar requirement help me out how to achieve. I am using tableau desktop 10.2. I have a cross tab table with different measures, percentages and derived calculations.
ReplyDeleteI have column level calculations like Col 1 = Col 12+Col11 and Col2 = Col14/Col13. When I try to add sub totals to this cross tab tableau adding all values in respective column and displaying total at the bottom. But my requirement is the subtotals should also populate values by following the column level calculations. When I work with Cognos we used to deal these things by using Solve Order functionality. Do we have similar kind of functionality to display column level calculations in sub totals. Attached is the reference doc for same.
COL 1 COL 2 COL 6 COL 7 COL 9 COL 10 COL 11 COL 12 COL 13 COL 14
Indecator 1 4.2% 6.0% 3.1% 37.5% 17,159 525 16,624 697 6,233 371
Indecator 2 2.9% 3.7% 3.1% 46.5% 15,588 477 16,111 472 7,486 276
Indecator 3 0.3% 0.3% 0.4% 28.2% 24,388 86 14,302 44 4,032 11
Indecator 4 0.2% 0.4% 0.6% 26.8% 28,728 175 28,553 67 7,651 34
Indecator Totals 1.5% 1.7% 1.47% 33.60% 85,863 1,263 75,590 1,280 25,402 692
Thanks-Vamsi.