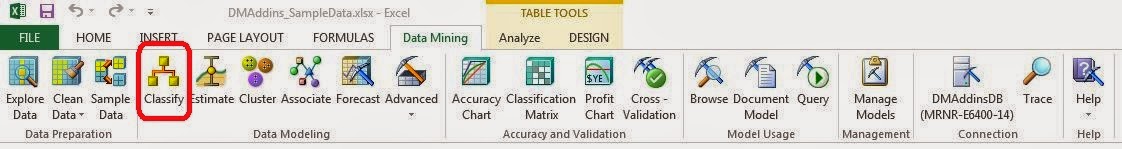
Today, we will be discussing the first of the Data Mining Tools, Classify.
 |
| Classify |
In our previous posts, we focused on the Table Analysis Tools. Those tools are very narrow, targetted ways to handle a single issue. They offer very little in the area of customization and can only be used on Excel tables, but are also very simple to use. The Data Mining Tools are one step more advanced. These tools offer some customization with the added complexity that comes with it. They also have the added functionality of being able to query your SQL Database directly using SQL. This is immensely useful if you are dealing with a data set that exceeds Excel's million row limit.
The Classify tool focuses on an area of Data Mining known as "Decision Trees". Basically, it's a series of cascading Yes/No questions that branch out like a tree. If you want a more complete explanation, you can check out the
wikipedia article. Let's jump in. As usual, we will be using the Data Mining Sample data set from Microsoft.
 |
| Select Data Source |
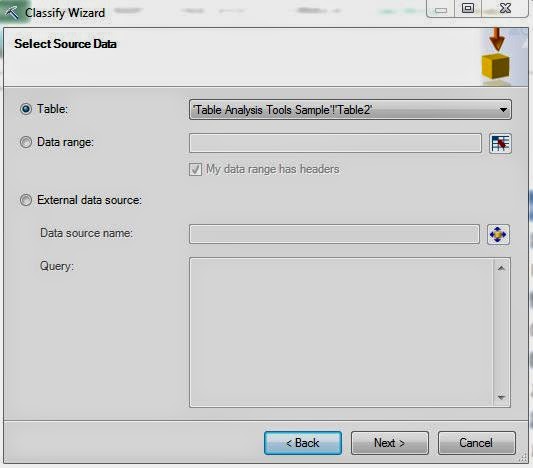
The first step to any analysis is to select a data source. We have our table in Excel. However, as we mentioned earlier, you can also use the "External Data Source" option to directly query a SQL Database. Let's move on.
 |
| Column Selection |
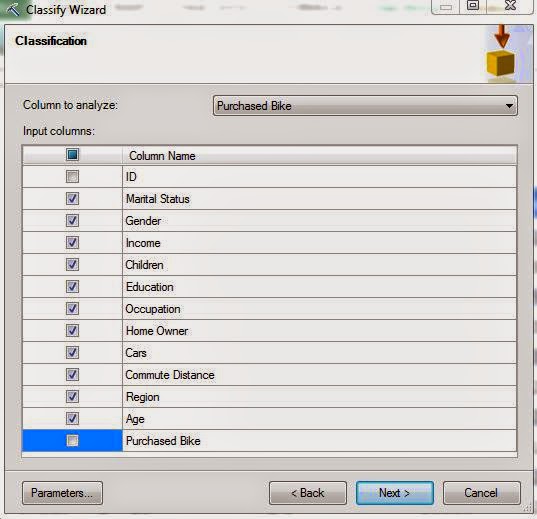
Next, we need to select which column we would like to analyze and which columns we would like to use for that analysis. Let's try to predict whether the customer will buy a bike using all of variables, excluding ID and Purchased Bike. Now, let's check out the "Parameters" section.
 |
| Parameters |
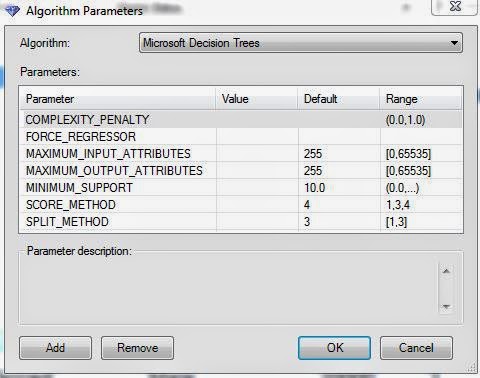
This is where the customization comes in. This algorithm has seven parameters that can be customized to narrow the analysis. We can see that most parameters have ranges that tell us the values that it expects. For instance, you couldn't put a value of 5 for the Complexity Penalty. Some of the values also have defaults. For specifics on how each of these parameters functions, look
here. We won't mess with these just yet.
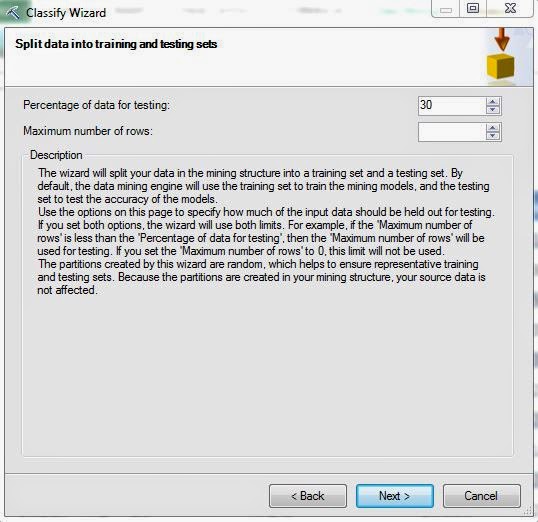 |
| Training Set Selection |
In every data mining algorithm, there are two sets of data that we use, Training and Testing. The Training Set is what the algorithm uses to develop the underlying rules and predictions. Then, it uses the Testing Set to see if the rules and predictions are accurate. We'll talk more about this later. Microsoft has a default of 70% Training, 30% Testing which is good enough for us. Let's move on.
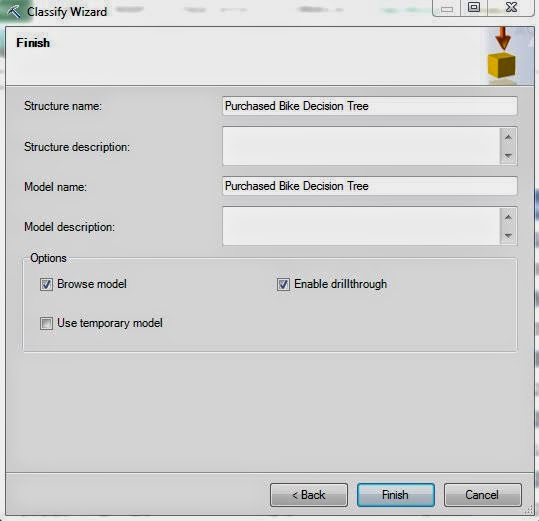 |
| Model Creation |
Finally, we get to a window we have not seen before. The Data Mining tools are not just ad-hoc analyses done in Microsoft Excel. They are actually legitimate data mining models built in Analysis Services. In Analysis Services, each model is stored within a structure. A structure is a logical grouping of models used for organizational purposes. When you go through the process of using a Data Mining tool, such as Classify, a structure and model are created in your Analysis Services instance. This is especially cool because it allows you reuse these models at later dates. We'll get to that much later in the series.
We have three options here, Browse Model, Enable Drillthrough, and Use Temporary Model. Browse Model allows us to see our results graphically in a similar fashion to the way we did for the Table Analysis Tools. Enable Drillthrough allows us to look at the underlying data that was used for a certain conclusion. Use Temporary Model would make our analysis temporary so that it doesn't appear in the Analysis Services instance. We typically enable the first two options. Let's see the results.
.png) |
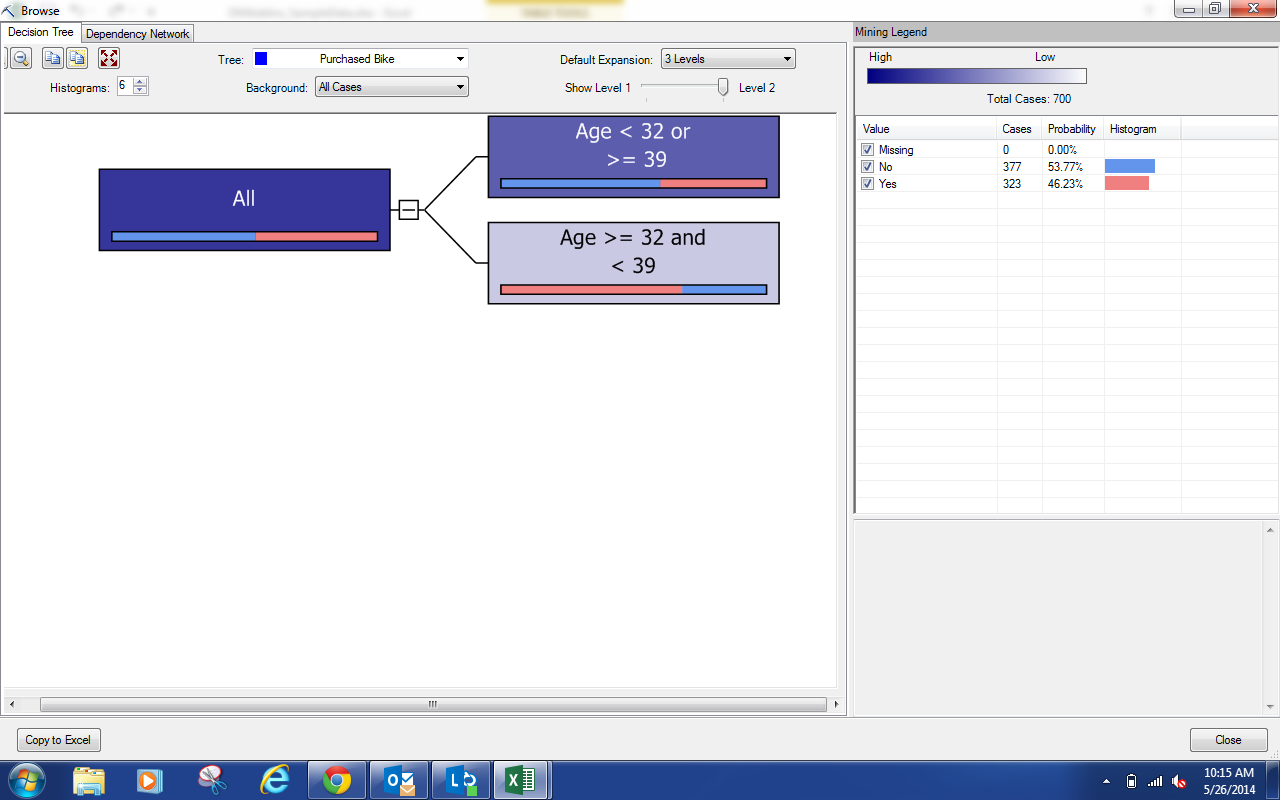
| Browse (All) |
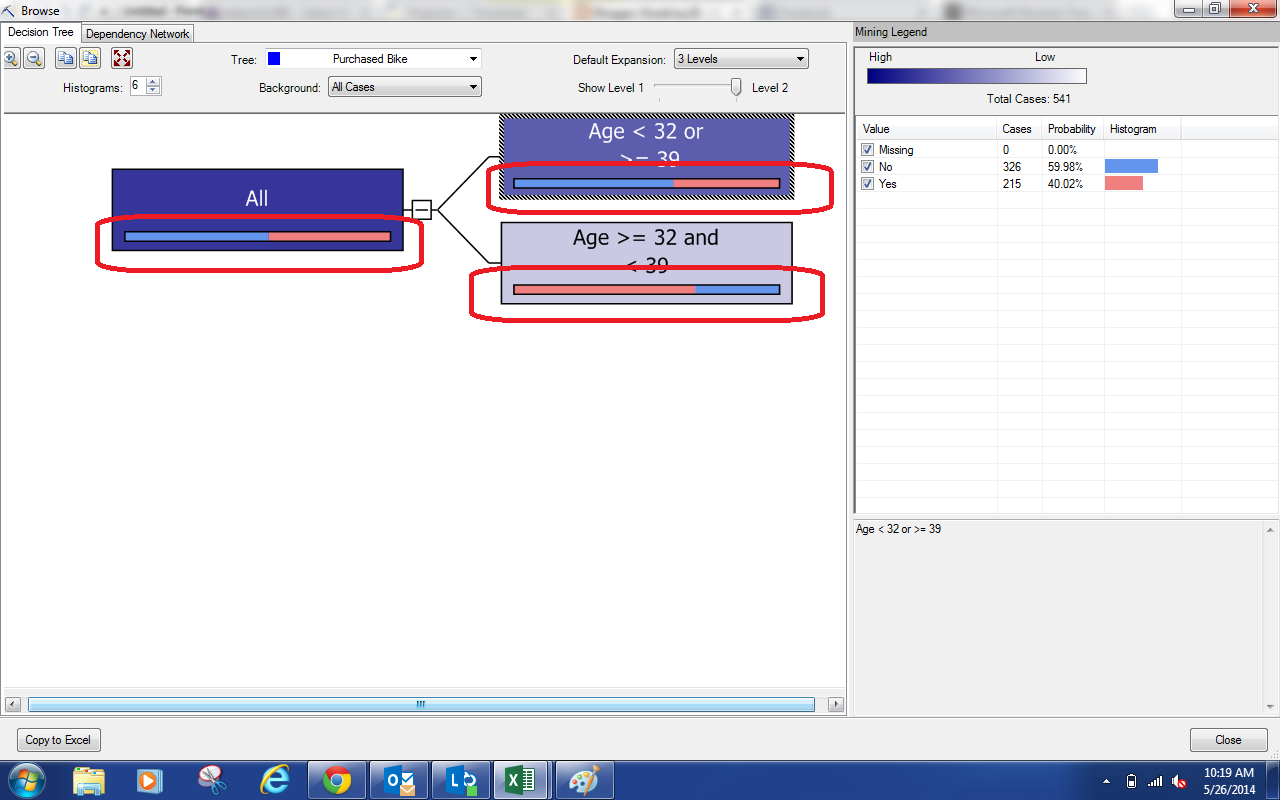
These results are not quite as flashy as the ones we were seeing from the Table Analysis tools, but they are much more useful as well. On the left side, we can see our tree (which currently only has one split). On the right side, we can see the composition of the selected node. Since we haven't selected anything, we see the composition of the population. If we select one of the nodes, we get a different story.
.png) |
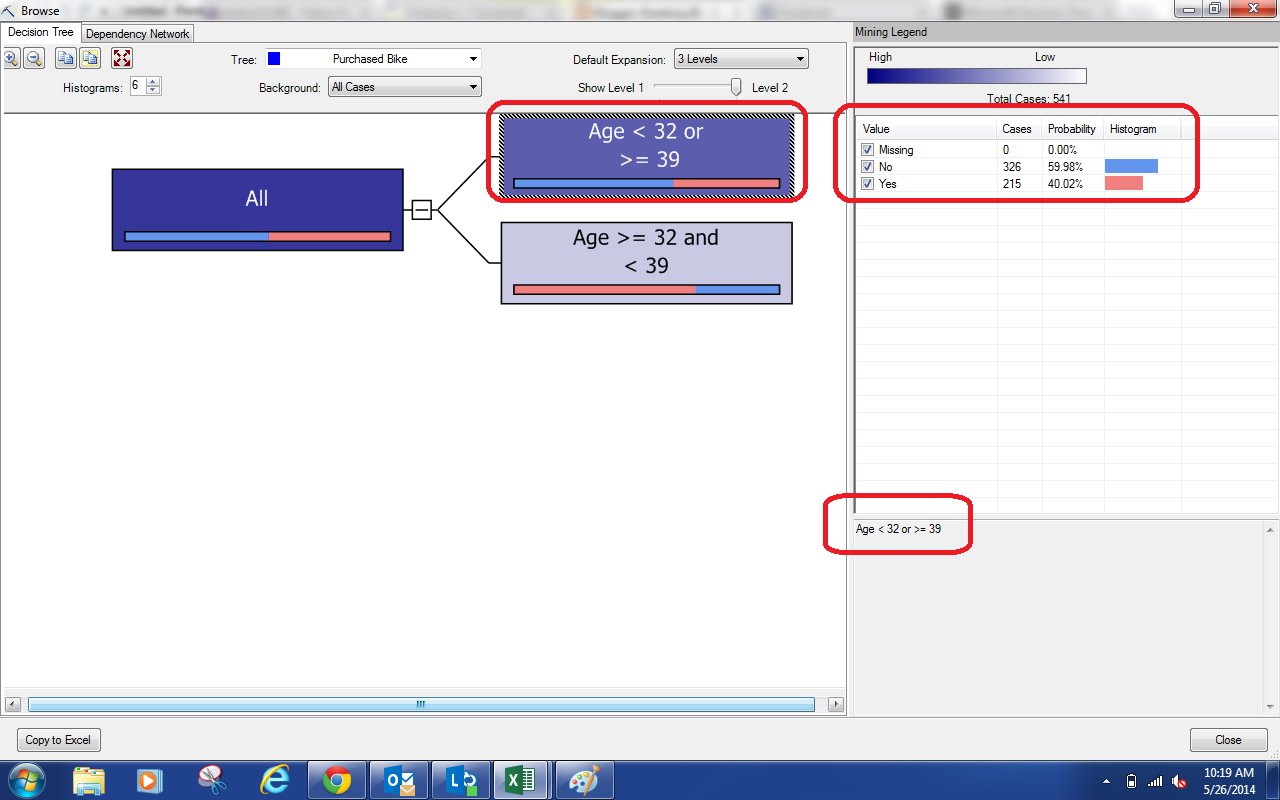
| Browse (Subset) |
If we look in the bottom-right of the window, we see the qualifications for the node we select, Age < 32 or >= 39. In other words, not in the 30s. We can see that this group has a high percentage of people who don't buy bikes. As a bit of a shortcut, we can look at the bar on the bottom of each node.
 |
| Shortcut |
The legend on the right side tells us that Blue denotes No and Red denotes Yes. So, we can look at the shortcut bars and see that the "Non-30s" node is mostly No and the "30s" node is mostly Yes. Since we selected the "Allow Drillthrough" option, we can right-click on a node and drill-through to the underlying data.
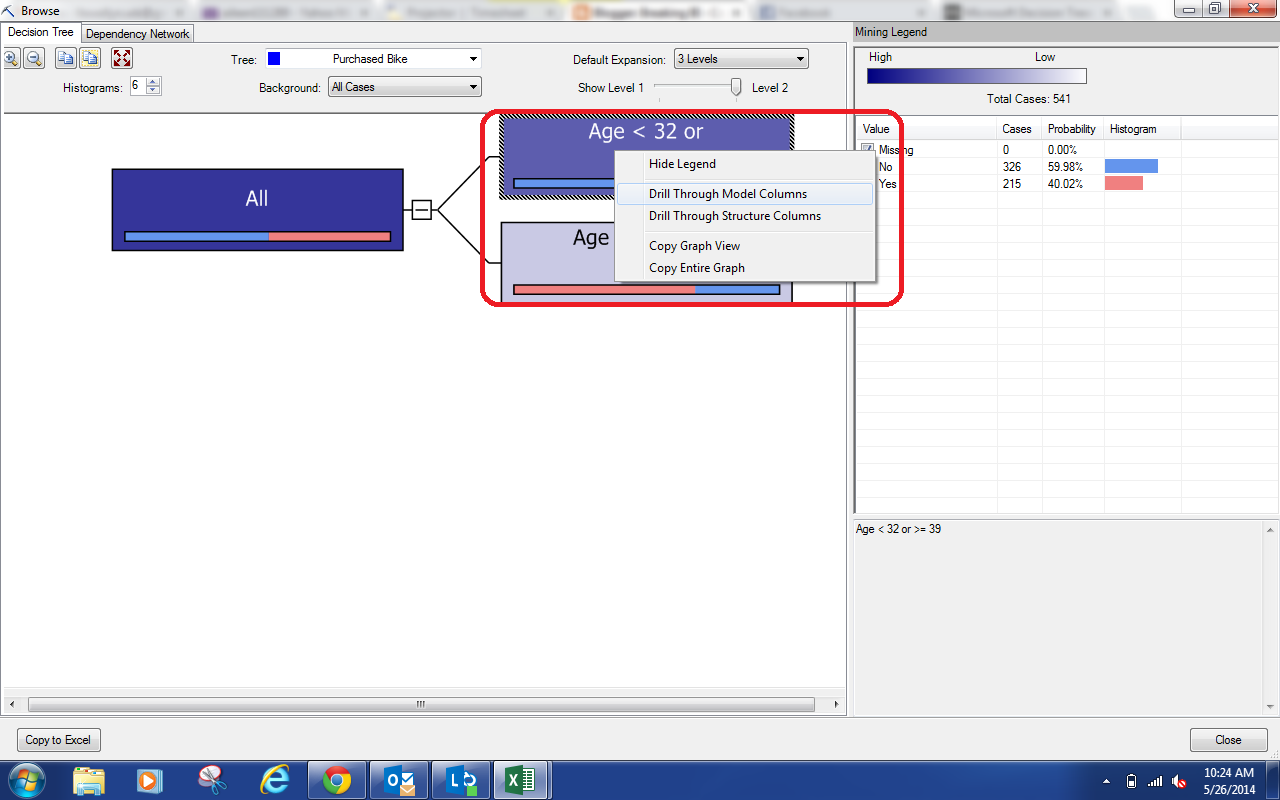 |
| Drill-through options |
We can drill-through to either the Model Columns or the Structure Columns. In our example, they are the same. However, if you were to create multiple models under the same structure, you could restrict some models to only use some columns. If we click one of the options, we see the underlying data.
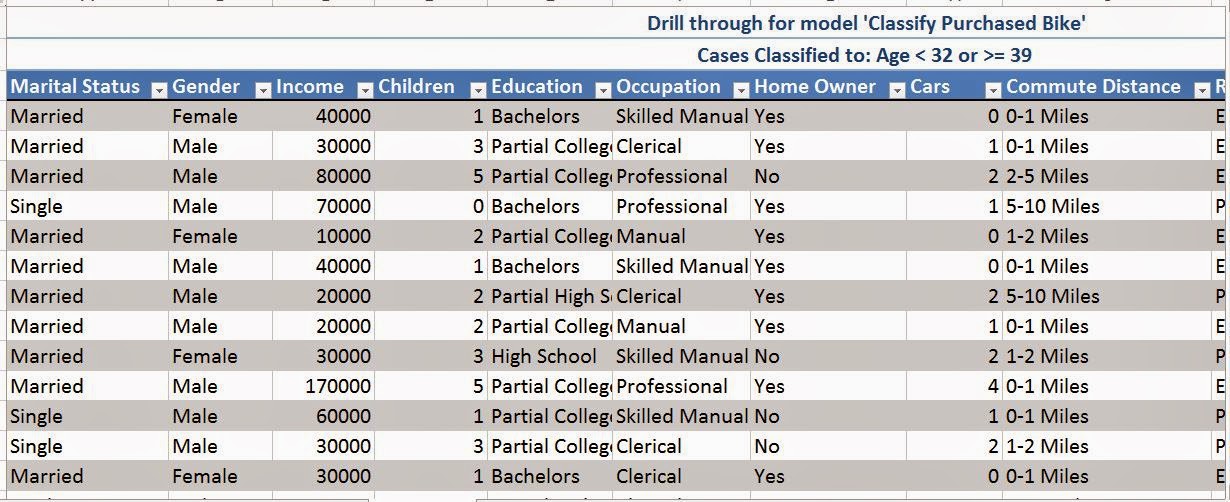 |
| Underlying Data |
This would be great if we wanted to do some further analysis on a particular node. Let's stop our analysis here for now. As you can see, there's quite a bit of customization that can be done here. Notice how our tree only had one branch? Stay tuned for our next post where we tackle that issue and show some more analysis that can be done using Classification Trees. Thanks for reading. We hope you found this informative.
Brad Llewellyn
Director, Consumer Sciences
Consumer Orbit
llewellyn.wb@gmail.com
http://www.linkedin.com/in/bradllewellyn
No comments:
Post a Comment