Let's imagine that we came up with a candidate list of models and want to see which ones are better for our type of data.
 |
| Too Many models |
Exponential Model
fit <- ets(timeser)
c(rep(NA, len.new), forecast(fit)[[4]][1:hold.orig])
ARIMA Model
fit <- auto.arima(timeser)
(rep(NA, len.new), forecast(fit)[[4]][1:hold.orig])
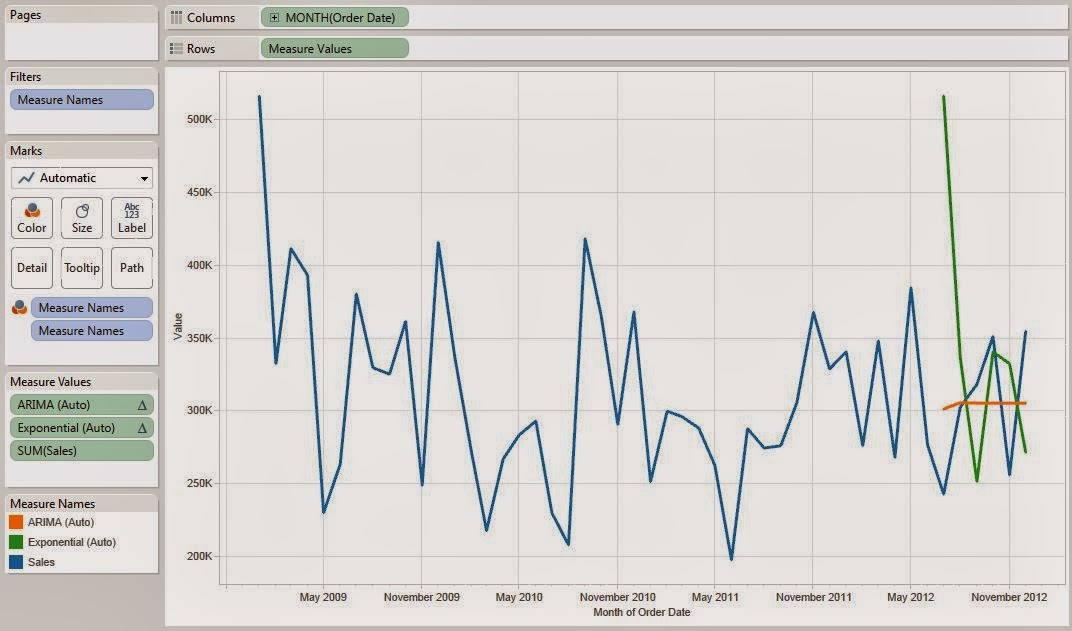
Now, let's look at our chart.
As you can see, these calculations quickly gave us two "good" candidate models to look at. You might notice that neither of these models fits the data extremely well. However, we could look at these models and see that the ARIMA model doesn't seem to be able to account for any of the variability, which is a very bad thing. The Exponential model seems much better, but still needs some tweaking. Therefore, we could throw out all of the ARIMA models and focus on creating a better Exponential model. In just a couple of minutes, we were able to narrow our modeling down to a single family! That's a huge time saver. Perhaps we could even improve this process by adding new functions and new techniques. But, that's a topic for another post. Thanks for reading. We hope you found this informative.
Appendix
ARIMA (Auto)
SCRIPT_REAL("
library(forecast)
## Creating vectors
hold.orig <- .arg4
len.orig <- length( hold.orig )
len.new <- len.orig - hold.orig[1]
year.orig <- .arg1
month.orig <- .arg2
sales.orig <- .arg3
## Sorting the Data
date.orig <- year.orig + month.orig / 12
dat.orig <- cbind(year.orig, month.orig, sales.orig)[sort(date.orig, index.return = TRUE)$ix,]
dat.new <- dat.orig[1:len.new,]
## Fitting the Time Series
timeser <- ts(dat.new[,3], start = c(dat.new[1,1], dat.new[1,2]), end = c(dat.new[len.new,1], dat.new[len.new,2]), frequency = 12)
fit <- auto.arima(timeser)
c(rep(NA, len.new), forecast(fit)[[4]][1:hold.orig])
",
ATTR( MONTH( [Order Date] ) ), ATTR( YEAR( [Order Date] ) ), SUM( [Sales] ), [Months to Forecast] )
Exponential (Auto)
SCRIPT_REAL("
library(forecast)
## Creating vectors
hold.orig <- .arg4
len.orig <- length( hold.orig )
len.new <- len.orig - hold.orig[1]
year.orig <- .arg1
month.orig <- .arg2
sales.orig <- .arg3
## Sorting the Data
date.orig <- year.orig + month.orig / 12
dat.orig <- cbind(year.orig, month.orig, sales.orig)[sort(date.orig, index.return = TRUE)$ix,]
dat.new <- dat.orig[1:len.new,]
## Fitting the Time Series
timeser <- ts(dat.new[,3], start = c(dat.new[1,1], dat.new[1,2]), end = c(dat.new[len.new,1], dat.new[len.new,2]), frequency = 12)
fit <- ets(timeser)
c(rep(NA, len.new), forecast(fit)[[4]][1:hold.orig])
",
ATTR( MONTH( [Order Date] ) ), ATTR( YEAR( [Order Date] ) ), SUM( [Sales] ), [Months to Forecast] )
fit <- auto.arima(timeser)
(rep(NA, len.new), forecast(fit)[[4]][1:hold.orig])
Now, let's look at our chart.
 |
| Automatic Models |
Brad Llewellyn
Data Analytics Consultant
Mariner, LLC
llewellyn.wb@gmail.com
https://www.linkedin.com/in/bradllewellyn
Data Analytics Consultant
Mariner, LLC
llewellyn.wb@gmail.com
https://www.linkedin.com/in/bradllewellyn
Appendix
ARIMA (Auto)
SCRIPT_REAL("
library(forecast)
## Creating vectors
hold.orig <- .arg4
len.orig <- length( hold.orig )
len.new <- len.orig - hold.orig[1]
year.orig <- .arg1
month.orig <- .arg2
sales.orig <- .arg3
## Sorting the Data
date.orig <- year.orig + month.orig / 12
dat.orig <- cbind(year.orig, month.orig, sales.orig)[sort(date.orig, index.return = TRUE)$ix,]
dat.new <- dat.orig[1:len.new,]
## Fitting the Time Series
timeser <- ts(dat.new[,3], start = c(dat.new[1,1], dat.new[1,2]), end = c(dat.new[len.new,1], dat.new[len.new,2]), frequency = 12)
fit <- auto.arima(timeser)
c(rep(NA, len.new), forecast(fit)[[4]][1:hold.orig])
",
ATTR( MONTH( [Order Date] ) ), ATTR( YEAR( [Order Date] ) ), SUM( [Sales] ), [Months to Forecast] )
Exponential (Auto)
SCRIPT_REAL("
library(forecast)
## Creating vectors
hold.orig <- .arg4
len.orig <- length( hold.orig )
len.new <- len.orig - hold.orig[1]
year.orig <- .arg1
month.orig <- .arg2
sales.orig <- .arg3
## Sorting the Data
date.orig <- year.orig + month.orig / 12
dat.orig <- cbind(year.orig, month.orig, sales.orig)[sort(date.orig, index.return = TRUE)$ix,]
dat.new <- dat.orig[1:len.new,]
## Fitting the Time Series
timeser <- ts(dat.new[,3], start = c(dat.new[1,1], dat.new[1,2]), end = c(dat.new[len.new,1], dat.new[len.new,2]), frequency = 12)
fit <- ets(timeser)
c(rep(NA, len.new), forecast(fit)[[4]][1:hold.orig])
",
ATTR( MONTH( [Order Date] ) ), ATTR( YEAR( [Order Date] ) ), SUM( [Sales] ), [Months to Forecast] )
i am getting subscript error for this linedat.new <- dat.orig[1:len.new,]. i am new to r .
ReplyDeletePraba,
DeleteThanks for commenting! A subscript error is caused when you attempt to access a part of the data matrix that does not exist. For instance, if there are 20 rows in dat.orig, then trying access row 21 will give you a subscript error. You would also get a subscript error if tried to access row -1. My first thought is that your [Months to Forecast] parameter is greater than the number of months in your data set. This would cause the value len.new to be negative. Is this the case?
I am getting the following error:
ReplyDeleteError in dat.orig[1:len.new, ] : subscript out of bounds
The only difference in my data set is that i am not summing sales. On the contrary i am counting the number of dates that appear in a particular month and forecasting that number moving forward.
As is, the forecast is overlayed ontop of the original data. Is there away to "append" a forecast to the end of the data, so it is predicting future data points?
ReplyDelete