Today, we're going to talk about performing Logistic Regression using Tableau 8.1's R functionality. Logistic Regression is very similar to Linear Regression, which we saw in the previous posts in this series. However, Logistic Regression is designed to predict binary (Yes/No, 1/0) outcomes. A very simple example is "Will this customer buy our product if we advertise to them?" For this exercise, we will use the ubiquitous AdventureWorks data set from Microsoft. If you've ever seen a Microsoft Data Mining demo, you've seen this data set. Let's start by looking at our data.
 |
| Customer Demographics |
As you can see, we have quite a bit of information about our customers, as well as whether or not they purchased a bike from us in the past. Now, let's look at a logistic model with only one predictor so that we can understand how it works.
.JPG) |
| Purchased Bike (Predicted by Age) |
As you can see, this code is extremely similar to the code for creating a linear regression model. The only differences are that this model uses a more complex function, glm(), and an extra parameter, family = binomial( logit ). Now, let's see what the predictions look like.
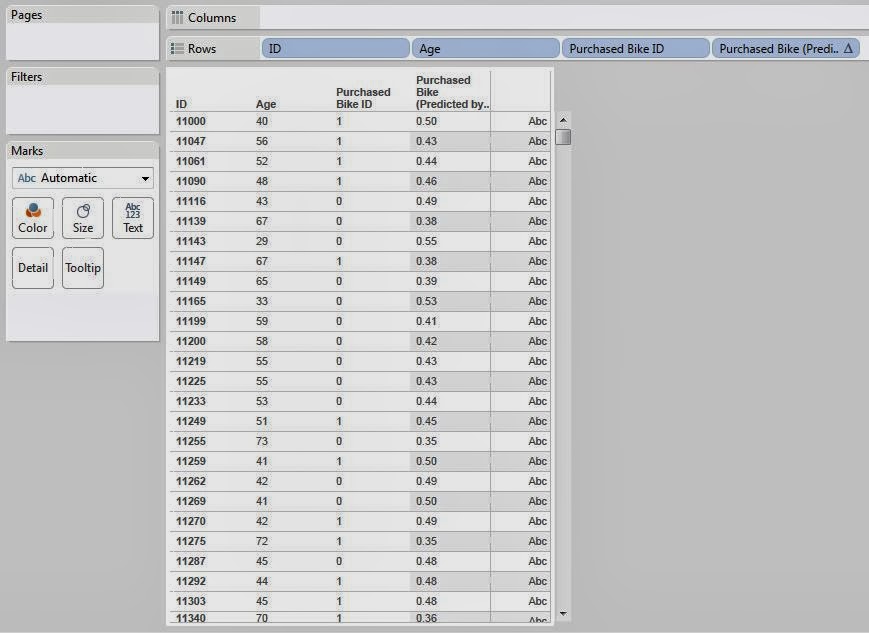
 |
| Predictions by Age |
Some of you will immediately ask why this function returns decimals when we asked it to predict a Yes/No response. Strictly speaking, logistic regression does not predict a Yes/No response, it predicts the probability of a particular response. In other words, it tells us how likely this person is to buy a bike. It's up to us to decide how we want to use these probabilities. Let's look at these predictions in another way.
.JPG) |
| Predictions by Age (Scatterplot) |
As you can see, the probability of buying a bike decreases as the customer gets older. This is an important, and not very surprising, discovery. Now, how do we turn these probability into actual predictions? That's up to us! An easy way is to say "If the chance is greater than 50%, we say they will buy. If it's less than 50%, we say they won't." Let's see what this gets us.
.JPG) |
| Predictions by Age (Classified) |
This procedure doesn't seem to be very accurate. Perhaps it's because we're only giving it one predictor. Let's throw the rest of our variables in there and see if it gets better.
.JPG) |
| Predictions (Classified) |
These predictions are much better, but still not as accurate as we'd like. Unfortunately, we couldn't find an easy way to look at these predictions in aggregate using this method. So far, it seems that the new R implementation is really good for generating predictions. However, it falls a little short when it comes to examining the model. Fortunately, there's even more we could do here. We could try a different model for this data, such as an artificial neural network or a bayesian model. Maybe one of our readers can find a really neat way to display this data that sums it up nicely. The rest is up to your imagination. We hope that you found this informative. Thanks for reading.
Brad Llewellyn
Data Analytics Consultant
Mariner, LLC
llewellyn.wb@gmail.com
https://www.linkedin.com/in/bradllewellyn

.JPG)
.JPG)
.JPG)
.JPG)
Nice write-up, Brad! I am struggling with how to use Tableau and R to build a predictor model from known (training) data and then apply the model to the unknown data. Have you come across an easy way to do that?
ReplyDeleteThanks for commenting! If you check out Part 3 of this series at
Deletehttp://breaking-bi.blogspot.com/2014/01/predictive-analytics-in-tableau-part-3.html
You should be able to augment this procedure to build a model out of training data and predict using testing data.
Thanks,
Brad Llewellyn
Hi Brad,
ReplyDeleteDo you know if the arguments in an R script can come from multiple data sources? I created a large crosstab view to make sure all my fields were aggregating correctly, but to do so I blended a lot of different sources (we'll eventually have a single Oracle table underlying the model, but not yet). I now get an error that I didn't see when running models using just one data source:
Error in `contrasts<-`(`*tmp*`, value = contr.funs[1 + isOF[nn]]) : contrasts can be applied only to factors with 2 or more levels
Any clue if this might be tied to using blended data sources?
Jim,
DeleteThanks for commenting. The R script is nothing more than a table calculation. This means that it sees the data as it appears on the canvas. Therefore, blended data should not cause an issue. On another note, this seems to be an issue with your R code. A quick google search led me to this link.
http://stackoverflow.com/questions/23414521/error-in-contrasts-tmp-value-contr-funs1-isofnn-contrasts-ca
Does this help?
Hi Brad,
DeleteThanks for the reply. I'd already read that Stack Overflow post but still thought my issue might be somehow tied to the data structure.
Turns out the code was fine, I had just filtered my data in such a way that there was no variation in one of my predictors (a field containing various university affiliations was limited to just "alumni" - a factor with one level, and R didn't like that). Once I removed the filter the script ran successfully.
Thanks for putting me on the right path!
Jim
This comment has been removed by the author.
ReplyDeleteThis comment has been removed by the author.
ReplyDeleteHi Brad
ReplyDeleteTxs for the blog posts. those are v-helpful
Can you kindly point me to the exact location of the AdventureWorks DataSet version you are using or better the Tableau WookBook of this part-4 episode ?
txs v-much
Jimmy