Today, we will talk about Introductory Data Modeling. These models will be slightly more advanced that the models we saw in
Tableau vs. Power Pivot Part 3: Basic Data Modeling. However, these are all tasks that a business analyst would face in the real world. For this examination, step into the shoes of an analyst working at a bank. We will use two mock-up data sets during this analysis.
Model 1: Fact Tables of Different Granularity
We have a list of transactions per customer as well as a list of closing balances for those customers. Let's take a look at these data sets.
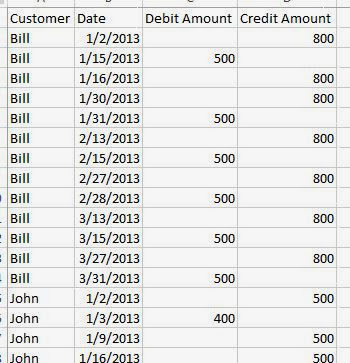 |
| Transactions |
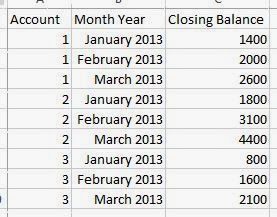 |
| Closing Balances (Multiple Fact Tables) |
Now, your job is to make sure that these numbers add up. Therefore, you need a way to combine the fact tables to do your analysis. Let's see how Power Pivot would handle this.
.JPG) |
| Multiple Fact Tables with Different Granularities (Power Pivot) |
It is important to note that every dimension we want to slice by needs its own table in the model. It is also important to note that we created a Month Year dimension. This is an extremely important dimension and the model would fail without it.
.JPG) |
| Closing Balance by Account and Month Year (Power Pivot) |
Closing Balance was extremely easy because the fact table already existed at this granularity. We simply used the pivot table to display the data we already had. However, getting the totals and subtotals to calculate correctly is a much more complex task that will be handled in a later post. For now, we simply chose to hide them. Now, we need to create a calculate that adds up our transactions in order to compare them to the closing balances.
+(Power+Pivot).JPG) |
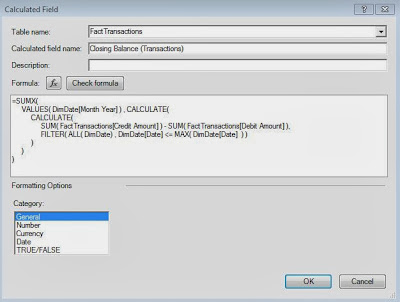
| Closing Balance (Transactions) |
Needless to say, this is not a beginner's calculation. It requires knowledge of filter context and row context, as well as how context propagates across calculates. At the heart of this calculation is the idea that we need add up all the credits for a month and subtract all the debits for a month. The rest is just syntax. Now, let's see if they add up.
.JPG) |
| Closing Balances by Account and Month Year (Power Pivot) |
As you can see, the numbers match perfectly and your boss is now very happy. Let's see how Tableau would handle this.
.JPG) |
| Credit Amount and Debit Amount by Account and Month Year (Tableau) |
As always with Tableau, we need to create our canvas first. In this case, we want to use Account by Month, just like in Power Pivot. Now, we need to create our calculation.
.JPG) |
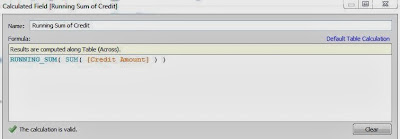
| Running Sum of Credit (Tableau) |
This calculation is probably the simplest of all table calculations. All we need to do is add up the credits for this month and all previous months, aka a running sum.
.png) |
| Running Sum of Credit by Account and Month Year (Tableau) |
The only caveat here is that we need to set the "Compute Using" to Pane. This allows the calculation to reset for each Account. Next, we can repeat this process for the debits.
.JPG) |
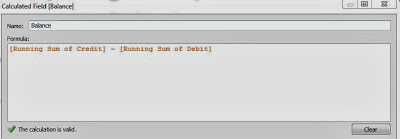
| Balance (Tableau) |
Finally, we calculate our balance by subtracting our two running sums.
.JPG) |
| Balance by Account and Month Year (Tableau) |
As you can see, these are the same values we got in Power Pivot. Now, we need to add Closing Balance to this sheet.
+(Tableau).JPG) |
| Balance and Closing Balance by Account and Month Year (Incorrect) (Tableau) |
As you can see, the closing balances are blending properly across Account (which exists in both tables) but not across MY(Date) (which doesn't exist in the closing balance table). So, we need to tell Tableau that it can blend MY(Date) with Month Year.
.JPG) |
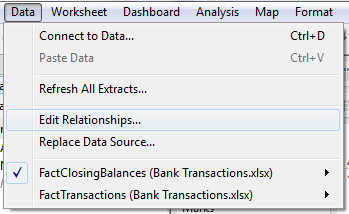
| Edit Relationships (Tableau) |
In the data menu, we can go to "Edit Relationships." This menu will allow us to tell Tableau how to blend across data sources.
.JPG) |
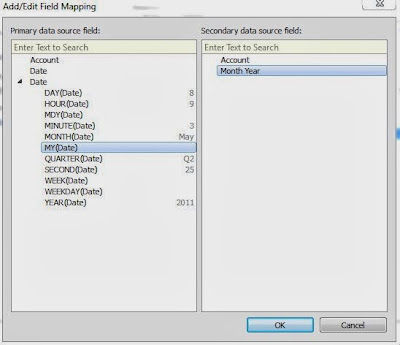
| Blend MY with Month Year (Tableau) |
Next, we need to tell Tableau that it can blend MY(Date) with Month Year.
+(Tableau).JPG) |
| Balance and Closing Balance by Account and Month Year (Correct) (Tableau) |
Finally, we need to make sure that the connections are being used. We can tell by looking at the Orange chain links in the Dimensions Shelf. We can see that the balances are in fact the same and we have kept our job.
Completing this task in Power Pivot took an advanced knowledge of DAX calculations. A beginner would have significant trouble with accomplishing this. In fact, we had so much trouble with it that we had to consult our colleague for assistance. Tableau, on the other hand, took only a beginner's knowledge of table calculations and how to edit a relationship. Any intermediate user should be able to complete this task without much trouble. Therefore, we can make our decision with ease.
Winner: Tableau
Many thanks to our colleague,
Javier Guillen, for helping us with the Power Pivot portion of this model.
Model 2: Many-to-Many (M2M) Relationship
The M2M relationship is one of the more complex modeling scenarios you will find. It seems to pop up in almost every scenario and each case is different. We will limit this model to a very simple M2M scenario. We have closing balances for 3 accounts.
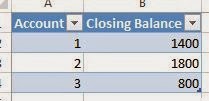.JPG) |
| Closing Balances (Many-to-Many Relationship) |
We also have a list of customers linked to each account.
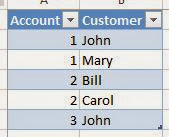 |
| Customers by Account |
As you can see, some of these accounts are joint accounts that have multiple customers linked to them. To make it even worse, John has 2 accounts, one of each type. So, why is this a problem?
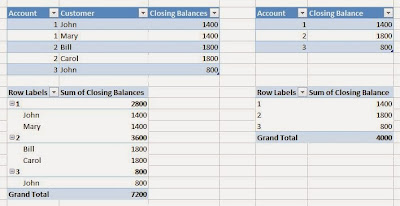 |
| Naive Many-to-Many Relationship |
As you can see, if you naively join these tables, the totals will be off because some of the balances will be duplicated. This is the epitome of the M2M relationship. So, how would you fix these totals? Let's try it in Power Pivot first.
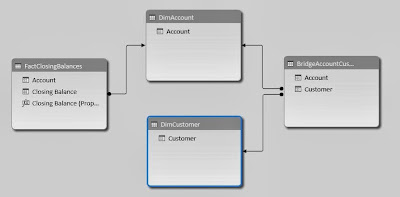.JPG) |
| Many-to-Many Relationship (Power Pivot) |
The most important part of any Power Pivot analysis is the model. In this case, we can see that the Customer dimension isn't even connected to the fact table. This is the issue we have to overcome. A very interesting blog post was written on this topic and can be found
here. Let's see the resulting calculation.
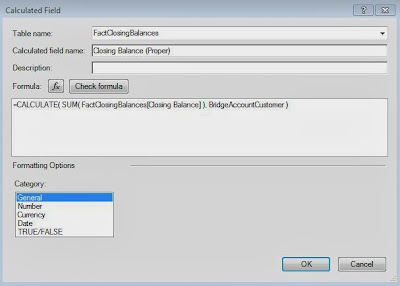+(Power+Pivot).JPG) |
| Closing Balance (Proper) (Power Pivot) |
As you can see, this calculation is simply 1 line of code. You wrap your aggregation in a CALCULATE() statement and tell it to use the bridge table. Power Pivot magically takes care of the rest. Well, it's not magic, but it sure seems like it the first time you see it. Let's see how our chart turned out.
 |
| Closing Balance by Account and Customer (Power Pivot) |
All of the totals add up correctly, now we can do our analysis on this data without having to worry about duplicates. Power Pivot even gives us an error letting us know that we have tricked it into doing our bidding. Let's move on to Tableau.
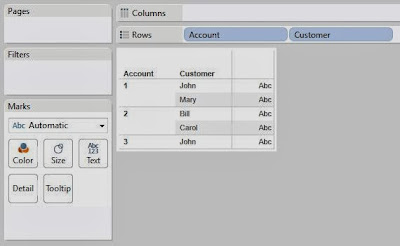.JPG) |
| Customers by Account (Tableau) |
We start by pulling Account and Customer from the bridge table.
.JPG) |
| Closing Balance by Account and Customer (Tableau) |
Then, we simply drag Closing Balance onto the chart and the blending takes care of the rest. Frankly, we work with Tableau every day and were still amazed that blending handled this situation so easily. This one was an easy decision.
Winner: Tableau
Summary
First, we saw that rolling up account balances is not a trivial task in either of these tools. However, Tableau showed us how it's blending mechanic can help out in these situations. Then, we saw that Power Pivot and Tableau were very strong at resolving Many-to-Many relationship. However, Tableau edged out Power Pivot because of the simplicity of data blending. We hope you found this informative. Thanks for reading.
P.S.
This is the last post in the beginning part of this series. From now on, the posts will focus on specific, advanced situations. We also will not be able to keep up the weekly pace that we have been. If you have any specific scenarios you'd like to see us test, send us an email and we'll see what we can do.
Brad Llewellyn
Associate Data Analytics Consultant
Mariner, LLC
brad.llewellyn@mariner-usa.com
http://www.linkedin.com/in/bradllewellyn
http://breaking-bi.blogspot.com

.JPG)
.JPG)
.JPG)
.JPG)
.JPG)
.png)
.JPG)
.JPG)
+(Tableau).JPG)
.JPG)
.JPG)
+(Tableau).JPG)


.JPG)
+(Power+Pivot).JPG)

.JPG)
.JPG)
No comments:
Post a Comment