Today, we will talk about calculating a distinct count in Tableau. There are a few calculations that are universal to analytic tools. They are SUM(), COUNT(), AVG(), MIN(), and MAX(). Distinct Count is a bit more complex, and it shows in the computation time. For this reason, Distinct Count only exists with certain types of data connects, e.g. SQL Server. However, there is a way to replicate it's functionality using a table calculation. This procedure was demo'd in the third webinar in my series. For those of you that missed it, you can watch the entire series at
http://www.mariner-usa.com/experience/videos/. As usual, we will use the Superstore Sales sample data set.
Before we begin with the steps, we'll look at the following post by
Joe Mako on the Tableau Forums, which can be found
here.
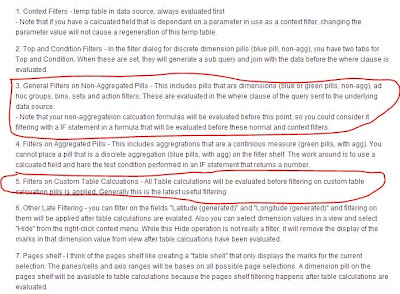 |
| Order of Filters |
I have circled the important ones for today. It is important to note that "General Filters" are calculated before Table Calculations. We will exploit this to create our distinct count.
Step 1:
- Create your chart at the grain you are counting, i.e. Products, Customers, etc.
 |
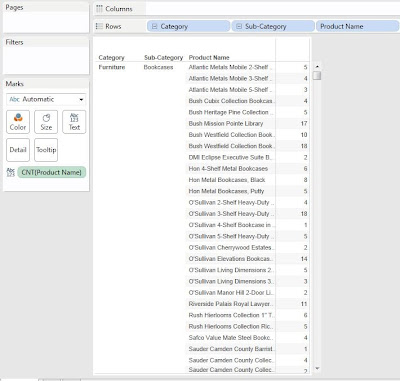
| Category, Subcategory, Product |
Now, we need to count the number of products within each subcategory. However, we cannot use the built-in COUNT() function because it counts at the grain of the data set, which is at the order line level. See how we get replication below?
 |
| Count of Products |
If this was a distinct count, each line would take the value "1". So, what we need to do is replicate a distinct count using a table calculation.
- Calculate the number of Product within each Subcategory.
- Create the following calculated field.
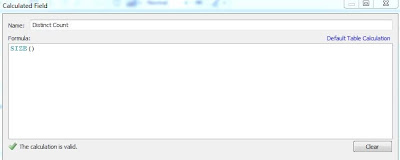 |
| Distinct Count |
The SIZE() function simply counts the number of rows in your visualization. In order to use this properly, we need to apply a Compute Using as well.
Step 3:
- Compute the calculation at the level of Product Name, restarting every Subcategory
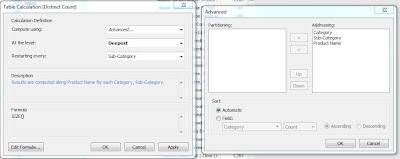 |
| Compute Using |
If you don't know how to get these windows, simply right-click the [Distinct Count] pill on the Text Shelf and select "Edit Table Calculation".
.JPG) |
| Distinct Count of Products (Unaggregated) |
Now, we have a distinct count of products within each subcategory. However, this chart is very long and it would be difficult to find an individual subcategory. Here's where the trick comes in, something we call the "Aggregator"
Step 4:
- Filter on the first product of each subcategory.
- Create the following calculated field.
- Drag the field to the Filters Shelf.
- Apply the following Compute Using.
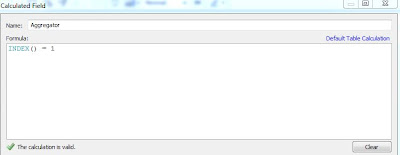 |
| Aggregator |
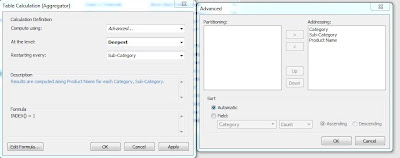.JPG) |
| Compute Using (Aggregator) |
What a surprise?!?! (Not really) This is the same Compute Using as our Distinct Count. Now, let's look at the result.
.JPG) |
| Distinct Count of Products (Aggregated) |
There's one final step we need to do to clean this up.
Step 5:
- Deselect "Show Header" from [Product Name]
.png) |
| Distinct Count of Products (Clean) |
Now, we have a pristine chart that shows Distinct Count of Products within each Subcategory. This is just the tip of the iceberg when it comes to Table Calculations. The aggregator is an extraordinarily powerful way to alter the way your charts look. Feel free to experiment. Thanks for reading. We hope you found this informative.
Brad Llewellyn
Associate Data Analytics Consultant
Mariner, LLC
llewellyn.wb@gmail.com
https://www.linkedin.com/in/bradllewellyn


.JPG)

.JPG)
.JPG)
.png)
Well said.
ReplyDeleteVery timely Post.
Very remarkable topic to talk about
Very remarkable point
Truly a remarkable subject to talk about
Thumbs up for a fantastic
Thank you....
local internet marketing
thank you. Very helpful
ReplyDelete