Today, we will talk about Top N% Filters in Tableau. In our opinion, there are two types of Top N% Filters. These are showing the top N% of Customers by Profit or the Customers that correspond to the top N% of Sales. To our knowledge, neither of these features are built-in to Tableau, yet they can be easily achieved using calculated fields. As usual, we will use the Superstore Sales sample data set in Tableau.
First, we will look at the Top N% of Customers.
Step 1:
- Create a chart of Profit by Customer, sorted by SUM( Profit )
 |
| Profit by Customer |
Step 2:
- Create a parameter for the N% you want
- Duplicate the parameter
- We will use the 2nd parameter for the 2nd filter
 |
| Top N% Parameter |
Step 3:
- Calculate the Total Number of Customers
- Create the following calculated field
 |
| Total Customers |
For those of you who read this blog often, you will recognize this method. It is an extremely simple method for executing a distinct count. Basically, it adds 1 for each row of Customer.
Step 4:
- Create a calculated field that returns true for customers less than or equal to the cut-off point.
- Create the following calculated field
- Add it to the filters shelf, filtering on "True"
 |
| Top N% Filter 1 |
Now, let's see if it works.
.PNG) |
| Profit by Customer (Filter 1) |
As you can see, there are a lot less customers in this chart than the original. You can play with the parameter to make sure it works. Now, let's work on filtering Customers that correspond to the Top N% of Sales. You might wonder why we don't just use Profit again. Since, Profit can, and sometimes will, be negative, you will get funny results if you use this technique on it. You are welcome to do it on your own to see.
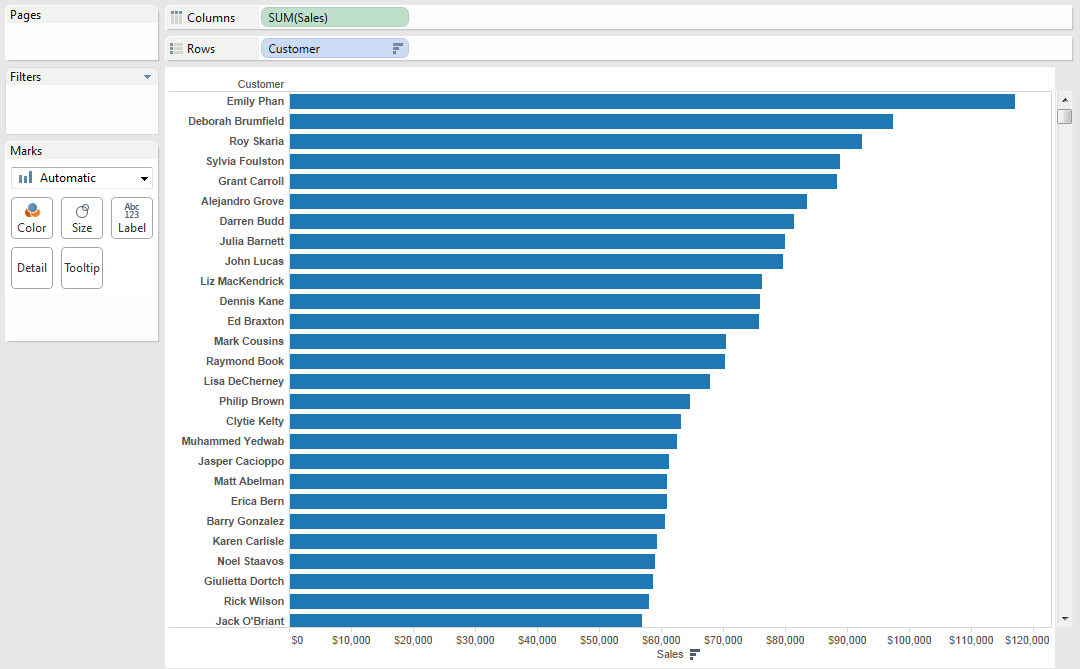
Step 1:
- Create a chart of Sales by Customer, sorted by SUM( Sales )
 |
| Sales by Customer |
Step 2:
- Calculate the Total Sales
- Create the following calculated field
 |
| Total Sales |
We could have used WINDOW_SUM() here, just like we did earlier. However, we'd imagine that WINDOW_SUM() is slower than TOTAL(), so we used TOTAL() here, primarily because this is exactly what TOTAL() is meant for.
Step 3:
- Calculate the Running Sum of Sales
- Create the following calculated field
 |
| Running Sum of Sales |
Step 4:
- Calculate which Customers are above the threshold
- Create the following calculated field
- Add it to the Filters Shelf, filtering on "True"
 |
| Top N% Filter 2 |
Now, let's see the results.
.PNG) |
| Sales by Customer (Filter 2) |
As you can see, calculated fields are very powerful when it comes to creating custom filters. I hope you found this informative. Thanks for reading.
Brad Llewellyn
Associate Consultant
Mariner, LLC
llewellyn.wb@gmail.com
https://www.linkedin.com/in/bradllewellyn


.PNG)


.PNG)
Hello Brad,
ReplyDeleteI have a set of different measures which I need to get into single hierarchy not a drill down as in dimension,because it looks messy to have lot of measures in the measures shelf. so is there way to accomadate a set of measure under a group/hierarchy.
Thanks,
Kathir
Kathirvelraja,
DeleteI actually just read your post on the Tableau forums about 30 2 minutes ago. To my knowledge, there is not a way to do this. In fact, there are quite a few ideas about this on the forums,
http://community.tableausoftware.com/community/ideas/content?query=measure+group
You may be able to use some type of parameter to clean it up a little. Check out this method,
http://breaking-bi.blogspot.com/2013/02/dynamically-choose-fields-displayed-on.html
Hope this helps,
Brad Llewellyn
Associate Consultant
Mariner, LLC
brad.llewellyn@mariner-usa.com
http://www.linkedin.com/in/bradllewellyn
http://breaking-bi.blogspot.com
Brad,
DeleteI like your suggestion on the blog and I tried it in another way by consolidating all measures in one calculated field and created a parameter and then performed calculation based on the parameter selection.
Thanks for the idea,
Kathir
Hey! Keep on with the good work. It is amazing to see people so motivated to help others. Thank you very much.
ReplyDeleteLove your blog! I've been doing a lot of research into business intelligence and this has really helped! Thank you!
ReplyDeleteGlad I could help! Thanks for reading.
DeleteHi,
ReplyDeleteIf we add a filter by 'Customer Name' or 'Customer Segment', then top N list not working properly. Is there any way get this done?
I think you're talking about the Top list you can make using Tableau's filtering abilities. That type of filter is evaluated BEFORE your other filters. That means it doesn't cooperate with other filters. There are two solutions I can think of. First, make your other filters context filters. This is not recommended if you plan to use them as quick filters. Second, you can make the Top N using a table calculation using INDEX() <= N. This type of Top N filter will evaluate AFTER your other filters. Was this what you were looking for?
DeleteIs there anyway to get a Top N% of sales within a Category?
ReplyDeleteOf course. This is where Compute Using comes in. You can refer to
Deletehttp://breaking-bi.blogspot.com/2013/07/introduction-to-table-calculations.html
if you need some more info.
Thanks!
Brad, thanks so much for this tutorial. I'm new to Tableau and really appreciate your use of an example data set so I may learn 'by doing.' I'm moving on to your other tutorials. Thank you!!
ReplyDeleteQuite effective. I am trying to add "Others" section which should include all the leftover with all their sales as single value. So as my top % moves, the other should do as well. any pointers? I have already done the top n vs others etc. The top % is throwing me off course.
ReplyDeleteOne of the most useful posts I have ran into lately. Thank you for sharing!
ReplyDeleteHi, I have another worksheet with the common dimension 'Customer' and would like to create the relationship with this worksheet. Meaning, whenever I filters the top 90% sales Customers, the second worksheet also shows me only the Customers resulted from the filter. Is it possible?
ReplyDeleteHi, I can't see some of the photos in this tutorial--can you check that they are all working?
ReplyDelete