Today, we will talk about how to create histograms in Tableau. When we say histogram, we are referring to the statistical concept of a histogram. Basically, this means we are looking at the distribution of values of a continuous variable. The following is a simple example. As usual, we will use the Superstore Sales sample data set in Tableau.
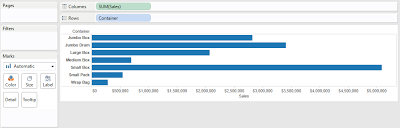 |
| Sales by Container |
This shows a continuous variable sliced by a discrete dimension. Despite the fact that some people refer to this as a histogram, we call it a "Bar Chart."
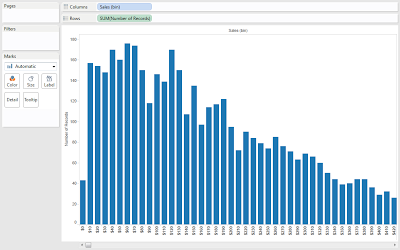 |
| Histogram of Sales |
This is what we refer to as a histogram. It shows the distribution of sales. Now, we will look at how to create these in Tableau. We will also show you a trick that we recently discovered for creating histograms at higher grain than the underlying data.
Step 1:
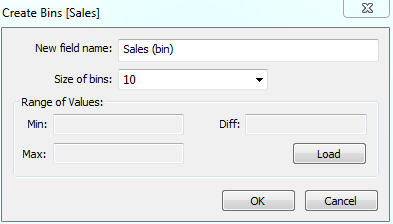
- Right-click [Sales] -> Select "Create Bins..."
.PNG) |
| Sales (bin) |
Step 2:
- Add [Sales (bin)] to the Columns Shelf
- Add [Number of Records] to the Rows Shelf
|
| Histogram of Sales (again) |
Now, you have created a histogram and can see that smaller [Sales] are more common than expensive ones. While this is good, what if you want to look at SUM( [Profit] ) per [Customer]? To our knowledge, there is no built-in way to do this in Tableau. Have no fear; there is a way!!!
Step 1:
- Create a [Bin Size] Parameter
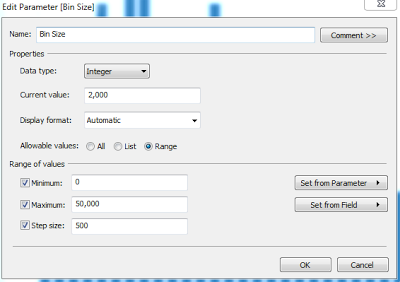 |
| Bin Size |
Step 2:
- Calculate the bin that corresponds to SUM( [Profit] )
- Create the following calculated field
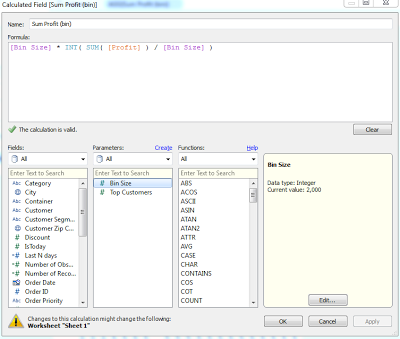.PNG) |
| Sum Profit (bin) |
Step 3:
- Calculate a 1 for each member at our new grain (which will be Customer)
- Create the following calculated field
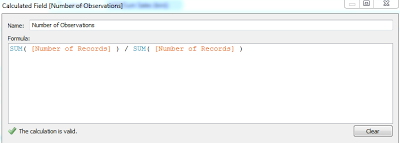 |
| Number of Observations |
Step 4:
- Drag [Customer] to the Detail Shelf
- Drag [Sum Profit (bin)] to the Columns Shelf
- Drag [Number of Observations] to the Rows Shelf
- Click on the Colors Shelf -> Change "Border" to "None"
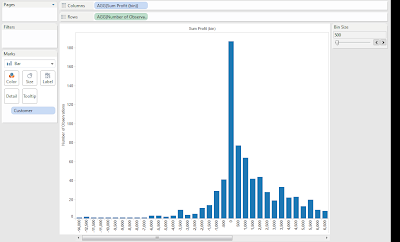 |
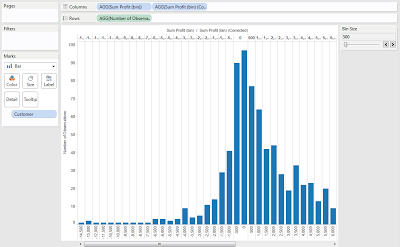
| Histogram of Profit per Customer |
You may notice something odd about this histogram. The zero bin seems to have a REALLY large number of values in it. This is actually because most of our bins are calculated as -200 to -100 or 100 to 200, yet the 0 bin is calculated as -100 to 100. That's twice as many possible values!!! Let's fix this.
Step 5:
- Shift the negative profits back one space to create room for the extra bin.
- Create the following calculated field
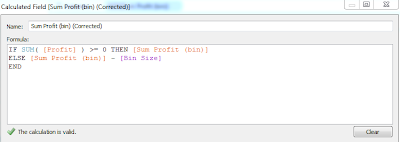+(Corrected).PNG) |
| Sum Profit (bin) (Corrected) |
Now, we can test this to see if our hypothesis was correct.
+Test.PNG) |
| Sum Profit (bin) Test |
We were right!!! There were two sets of values in the zero bin. Now, let's remove [Sum Profit (bin)] from the chart to get our final histogram.
.PNG) |
| Histogram of Profit per Customer (Corrected) |
Now, we can see that most customers are worth between -$500 and $1000. While creating this method, we did find one interesting flaw in this design. We could not find a way to calculate the total number of observations in each bin. We tried using WINDOW_SUM(), but were unable to get it to restart because [Sum Profit (bin)] is not a dimension, but a discrete measure. If anyone knows any way to get around this, let us know. We also have another treat. Remember the Z-Test workbook we created a couple of weeks ago? We were able to use this technique to add a histogram sheet to that workbook. Here's a sneak peek.
Brad Llewellyn
Associate Consultant
Mariner, LLC
llewellyn.wb@gmail.com
https://www.linkedin.com/in/bradllewellyn


.PNG)

.PNG)


+(Corrected).PNG)
+Test.PNG)
.PNG)

Hi Brad, I saw your link to this post and the question on how to get the total number of observations in each bin, the key is to uncheck the "Ignore in Table Calculations" option on the discrete (Sum) Profit Bin (corrected) measure. I set it up with a couple of other optimizations in this view: http://public.tableausoftware.com/views/histogramwithcustomeronLoD/mostaccurate.
ReplyDeleteThanks Jonathan.
DeleteHi Brad, I am new to Tableau. Sorry if I ask basic questions.
ReplyDeleteCan you explain the calculations in Step 2 and Step 3? What is the purpose of multiplying by bin size in step 2 and what is the purpose of the number of observations which always returns 1 - or does it? If I just substitute 1 as a hardcoded value there, what happens?
Siraj,
DeleteIn step 2, I needed to code the following scenario
Create a set of discrete marks at every [Bin Size], i.e. 1 * [Bin Size], 2 * [Bin Size], etc. Then, if an observation is between two bins, which is almost always will be, place it in the lower bin.
What I did was simply a simple mathematical way to achieve that using truncation.
As far the [Number of Records] goes, you could easily replace it with 1 and nothing would change. In fact, there is a better way to using SIZE() that I've started using.
Thanks Brad. That is a pretty good explanation. I understood Step 2 now.
DeleteBut I do not understand the need for the [Number of Observations] calculated field. In other words, you have to explain how the Step 4 is actually interpreted by Tableau as that is where you are using this 1 to count the number of customers.
On step 5, how did you get the 2 profit bins to display side-by-side. No matter what I tried i could not get to this view.
Also, when I did step 5 as per your instruction, I did not get this chart. Then I changed the mark type to bar to get this.
Basically, when you have Number of Observations, it returns 1 for every customer in that bin. Then, when you place customer on the detail shelf, it stacks all of these 1's on top of each other, giving the illusion of a bar.
DeleteFor Step 5, I had 2 discrete measures, Profit Bin and Profit Bin (Corrected). Placing both of these on the columns shelf allowed us to see what they have in common.
Thanks Brad for the answers.
ReplyDeleteThis is really helpful. One question: why did you set the current parameter value at 2,000?
ReplyDeleteYou can change the parameter to be whatever value fits your data best. I just chose 2000 because it worked.
Delete