IF [Year] = 2012 THEN "2012" ELSE "Other" END
This statement returns the string "2012" if [Year] = 2012, and "Other" if [Year] <> 2012. (For those who are less techy, <> is the "not equal to" operator.) As usual, we will use the Superstore Sales sample data set in Tableau.
Step 1:
- Create a graph of Sales by Container
 |
| Sales by Container |
Step 2:
- Categorize the Containers by how much Sales they generate
- Create the following calculated field
 |
| Container Category |
- Add [Container Category] to the graph to check the results
.PNG) |
| Sales by Container (with Container Category) |
We've created a simple calculation that tells us how our Containers are performing, without having to scan through a list of numbers. We could make this even easier by adding colors, or using something other than a text table. However, we'll leave that up to you.
Let's shift over to that trick we mentioned earlier. Let's say you want to calculate the total sales for your containers like we did earlier. However, the Boxes should only be calculated for the last 30 days and everything else should be calculated for the last 45 days. We've often received the question "How do you calculate a total over the last X days for one product and Y days for another?" You're about to see!!!
Step 1:
- Create the graph of Sales by Category
- Filter the graph to only show the last 30 days
Wait a minute!!! If we filter the graph to only show the last 30 days, all of the containers will show the last 30 days; the same goes for 45 days. How do we make them different?
Step 2:
- Remove the Date filter (if you added it at all)
- Calculate the 30 day sum for boxes and 45 day sum for the other categories
- Create the following calculated fields
This is a complex step; so, we'll walk through it step-by-step. First, decide which type of container you have as follows:
 |
| Container is Box? |
 |
| Anchor Date |
 |
| Augmented Sales by Container |
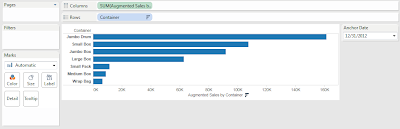 |
| Final Graph |
Brad Llewellyn
Associate Consultant
Mariner, LLC
llewellyn.wb@gmail.com
https://www.linkedin.com/in/bradllewellyn
https://www.linkedin.com/in/bradllewellyn
Hey Brad. This is helpful stuff - thanks! I am new to Tableau so forgive the potentially 'newbie' question but I am looking for a way to set the size of custom shapes dynamically and 'absolutely' if you will. In other words I don't want to all the sizes to be relative to each other (which seems to be the default in Tableau).
ReplyDeleteTo give you some context, I am building a dashboard that uses a background image of a retail store layout and I am placing a set of custom shapes on top - one for each dept. Each shape color will indicate sales for that dept. My issue is I want the custom shape to 'fill' the dept area below so each one will need to be a different size. Make sense?
Any suggestions on the best way to do this? A CASE seems too manual but I guess could work if you can return a size attribute from the spreadsheet (which it doesn't look like you can). What is need is something like IF [deptName] = "sporting goods" THEN [deptSize] = "300". It also doesn't look like you can use arrays in Tableau which seems like it would help in this situation.
Any thoughts appreciated!
Thanks in advance!
Greg
Greg,
DeleteThanks for commenting! It sounds like what you really want is a polygon map. Check out this information and see if it helps.
http://kb.tableausoftware.com/articles/knowledgebase/polygon-shaded-maps
Appreciate the response Brad. I did look at this option before the 'custom shape' option but it seems Tableau only accepts lat/long coordinates for shapefiles. YOu can't just feed in a bunch of x,y coordinates - which would be ideal. I will let you know what I figure out!
ReplyDeleteThannks again for your help!
Greg
Greg,
DeleteCheck out this video
http://www.tableausoftware.com/learn/tutorials/on-demand/background-images
Hi Brad, I am tying to count PAYMENT <>0 as 1. here is my formula, if ([Pos Patient Payment])<>0 then count 1 else 0 END, but it gave me an error message saying expect end to match if at character 0. can you help advise? thank u!
ReplyDeleteThanks for commenting! Between your THEN and ELSE you have a piece
ReplyDeletecount 1
This does not follow Tableau syntax and is likely the cause of the issue. Changing your code to
IF [Pos Patient Payment] <> 0 THEN 1 ELSE 0 END
should fix it. Does that help?
Hi,
ReplyDeleteIF [deptName] = "sporting goods" THEN [deptSize] = "300".
How do we implement this?
Regards
Hi Brad.
ReplyDeleteI want to use if condition for percentage of difference column. How do I create a caluculated field for that ?
eg:
2012 - 6.7%
2013 13.2%
I got the % by doing quick table calculation - percentage difference
if it is greater than 0 then green else red
Thanks
Dropping by to say thanks for this. I've read your blog many times and gotten good information. I've used IF statements before but today I was stuck and a short time here got me moving along quickly.
ReplyDeleteHey Brad,
ReplyDeleteI have a similar formula to build upon like,
count [A] = count [B] yes
count [A] = count [C] yes
count [A] = count [D] yes
else No
end
is this the correct approach? the formula is valid however I am not getting the correct output on the screen,
kindly advice.
Brad,
ReplyDeleteCan you see what is wrong with my IF?
IF [WEEK] = ( max([WEEK])-1 )
THEN 'LastWeek'
ELSE 'Not LastWeek'
END
I need help with this IF statement. I am using a database table and an Excel spreadsheet as my source data. Trying to add a calculated field using the following IF statement but keep getting error "Expecting THEN to match IF at character 25".
ReplyDeleteIF [Var Cd] = 'OU'
THEN IF [Var Amt]+ [Var Adj Amt1] < [T_DATA (FB)].[Over Under Min]
THEN [T_DATA (FB)].[Over Under Min]
ELSEIF [Var Amt]+ [Var Adj Amt1] > [T_DATA (FB)].[Over Under Max])
THEN [T_DATA (FB)].[Over Under Max]
ELSE [Var Amt]+ [Var Adj Amt1]END END
Hi Team,
ReplyDeletei need this calc should be clubbed for three measures,profit,sales,discount
lookup(SUM([Sales]),0)>lookup(sum([Sales]),1)