 |
| Period to Date Text Table |
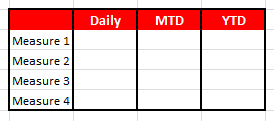 |
| Period to Date Matrix Mock-Up |
Here, the report date is always the previous day. This means that we no longer have a time dimension in our graph. Also, our measures are not on the same shelf as our table calculations. How can we accomplish this?
Step 1:
- Create the following calculated field
 |
| Period to Date Calculated Field |
 |
| Calculated Field Mock-Up |
Step 2:
- Add "Period to Date" to the "Columns" Shelf
- Filter "NA" out of "Period to Date"
- Add your measures to the "Text" Shelf
.PNG) |
| Period to Date Matrix |
Step 3:
- Change each measure to a running sum across the row
 |
| Period to Date Matrix |
One issue with this method is, it requires that the measures be additive, or at least made up of additive components. Feel free to play around with this method. You can create a parameter or calculated field that would allow you to change the "Report Date" to your liking. I hope you found this informative. Thanks for reading.
EDIT: I found an issue with this methodology. If the data date is the first day of the month, first month of the year, etc., you will not have "Month to Date" or "Year to Date" in your data set, respectively. The workaround we used was to move the Period-To-Date function down into the SQL query and union hard-coded rows onto the data set for each missing value of the Period-To-Date function.
Brad Llewellyn
Associate Consultant
Mariner, LLC
llewellyn.wb@gmail.com
https://www.linkedin.com/in/bradllewellyn
https://www.linkedin.com/in/bradllewellyn
Hi Brad
ReplyDeleteI read about this article
Where dimension [Report Date] comes from?
I tried use parameter date for [Report Date] but it still not have same result like what you do