Today, after months of creating and validating models, we get to the final piece of the Data Mining puzzle, Querying your Model. In addition to Querying, we'll also briefly touch on the other components of the Model Usage and Management segments.
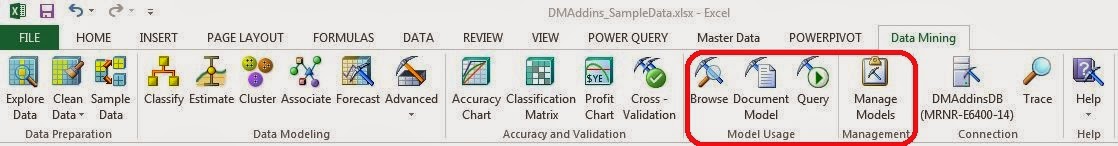 |
| Model Usage and Management |
First, the Browse option allows you see the Result sets we've been looking at all along. For instance, let's check out the Results from our Classify Purchased Bike Model.
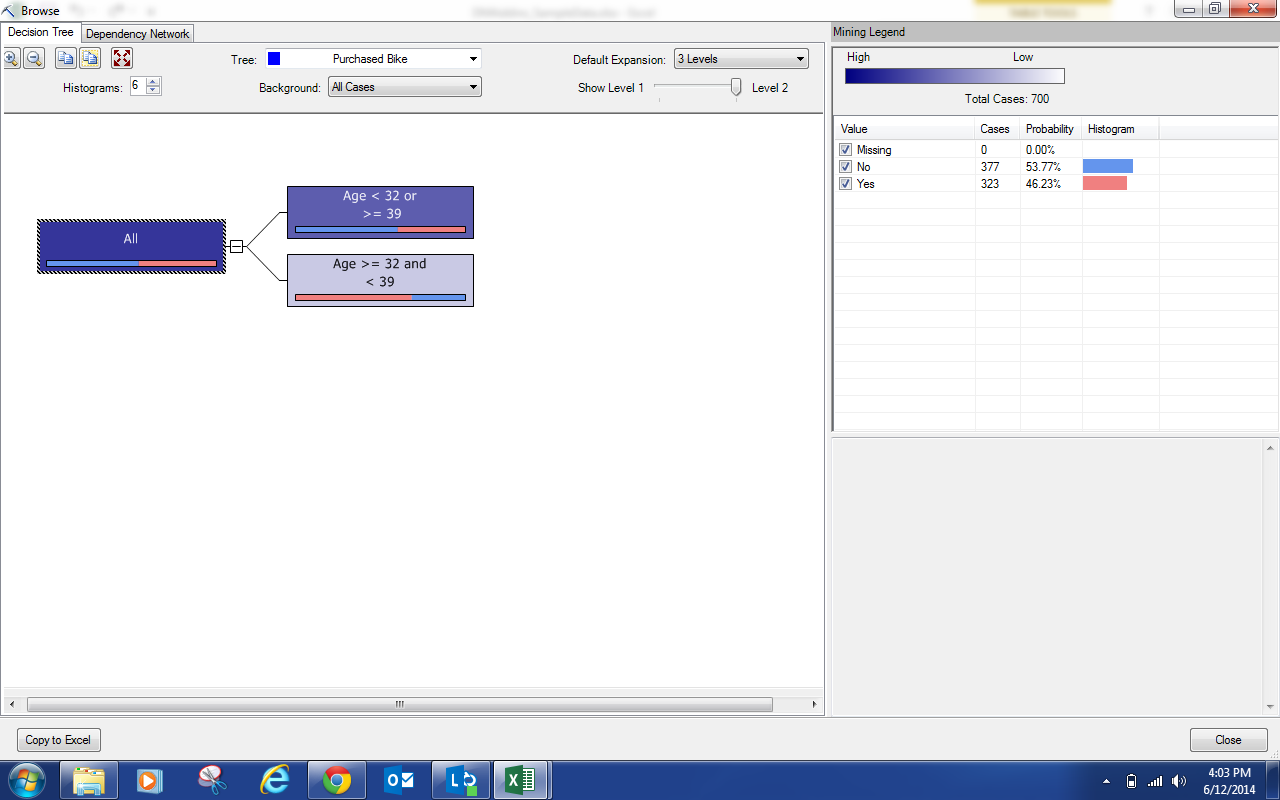 |
| Browse |
Now, what if you needed to provide documentation of the model you built to allow other people to reference it later? The "Document Model" option does exactly that.
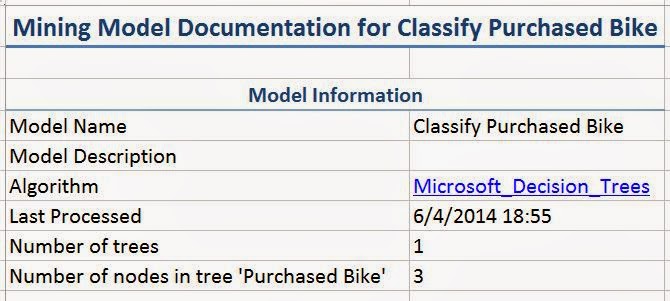 |
| Summary Information |
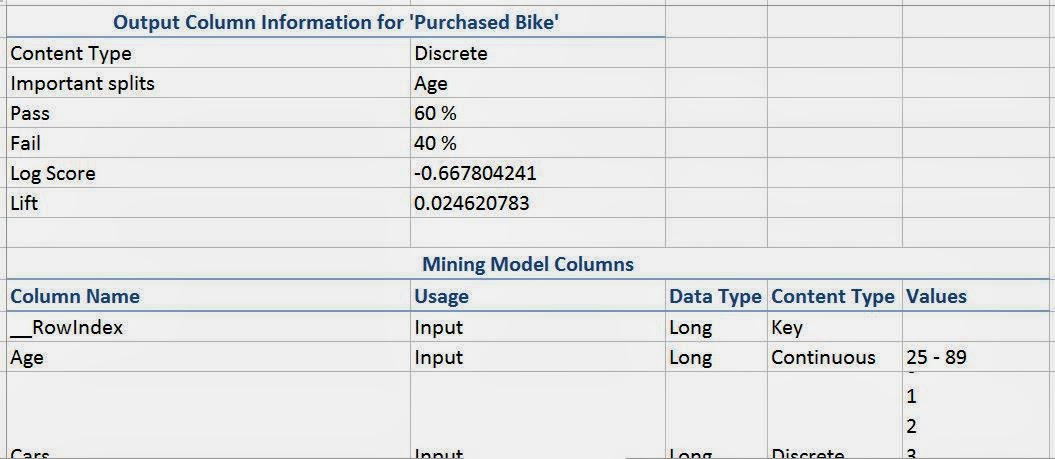 |
| Complete Information |
You can choose to get a short amount of Summary Information or you can choose to get a long list of Complete Information that has basically all of the information about your model. This can be very helpful in a large-scale production environment.
Next, you can use the Manage Models option to rename, delete, clear, process, export, and import models. This can be really helpful when you are using these models quite a bit over long periods of time.
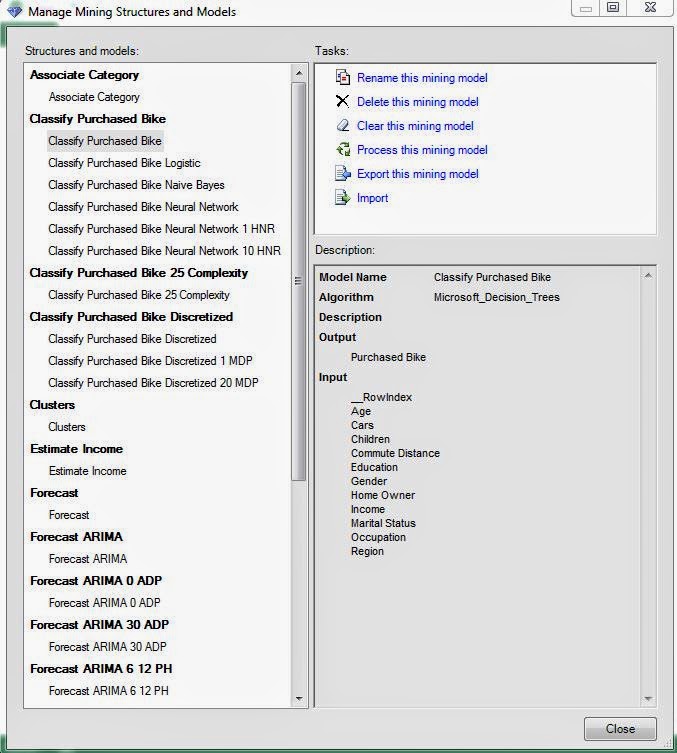 |
| Manage Structures and Models |
Finally, let's get to the Querying. You be wondering "Why did you make us wait 31 weeks to get this information?" Well, querying a model is one of the easiest thing to do. However, that's only the very last piece of an analysis. What truly separates good data miners from bad ones is how well they analyze and validate their models. That's why we spent such a large amount of effort in those areas. Now, let's click on the "Query" button and see what happens.
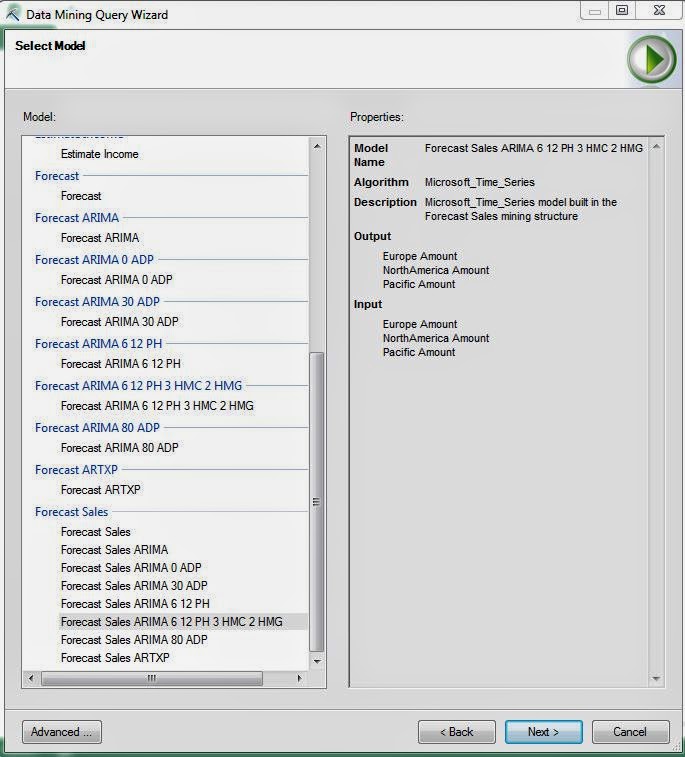 |
| Select Model |
First, we need to select the Model that we would like to query. Let's say that we want to use our Forecasting models. Remember that we chose the Forecast Sales ARIMA 6 12 PH 3 HMC 2 HMG as our best model. Let's keep going.
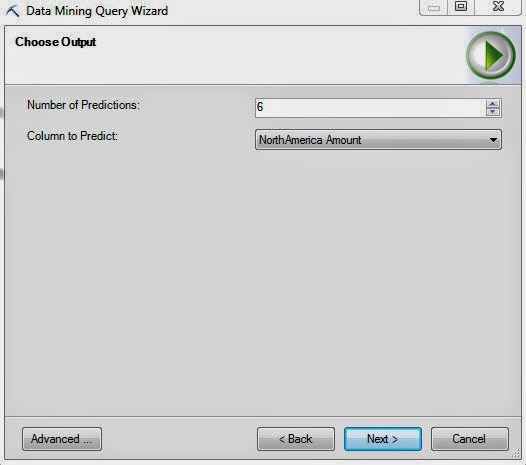 |
| Choose Output |
Next, we need to choose how many months into the future and which series we would like to predict.
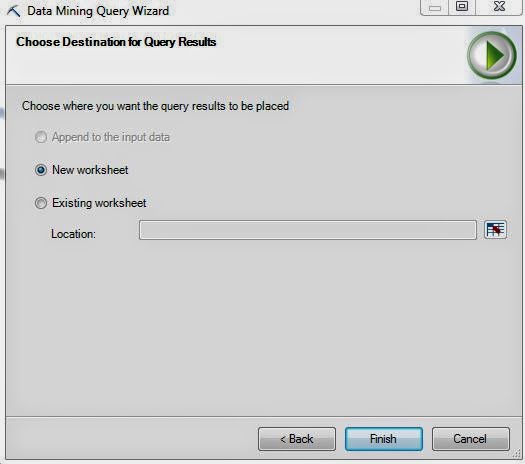 |
| Choose Destination |
Finally, we need to choose where we would like to store these predictions. Let's check them out.
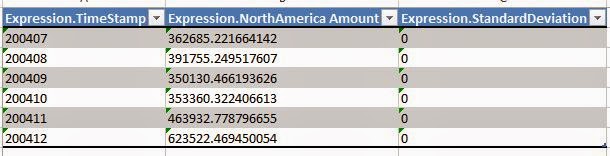 |
| North America Amount Prediction |
See how easy that was? Remember when we chose our Naive Bayes Model as the best model for predicting who is going to buy a bike? Let's try it with that model.
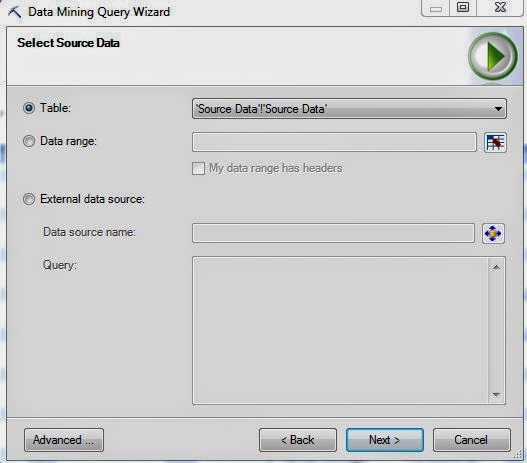 |
| Select Data Source |
When we queried our forecasting model, we didn't have to specify an input because the model always predicts based on previous values. However, the classification predicts based on other values for that observation. This means that we have to specify some input data. Let's use the Source Data, which contains ALL of the customers. Let's keep going.
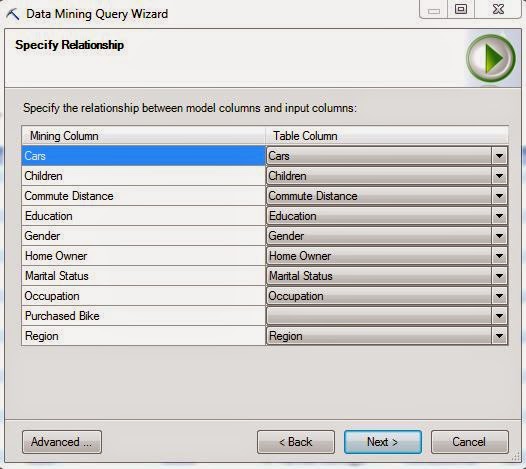 |
| Specify Relationship |
Since the input data may be different from the training data, we need to make sure that all of the columns match up. Since this data is formatted the same way, we have the same column names. Let's move on.
.JPG) |
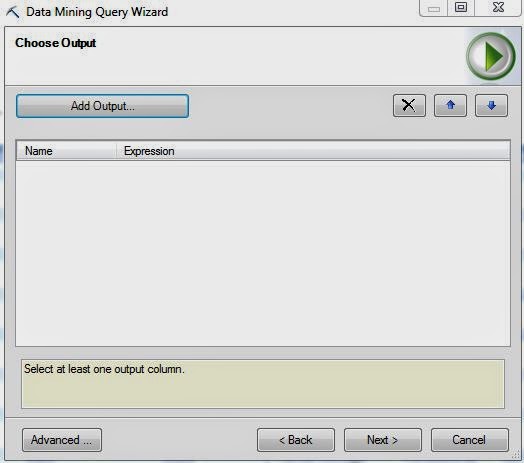
| Choose Output (Empty) |
Here, we have a slightly different Choose Output window. We need to decide which types of output we would like by clicking the "Add Output" button.
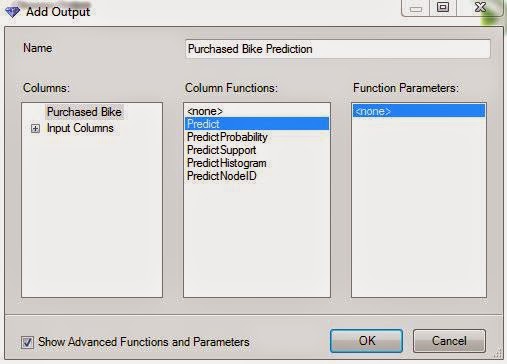 |
| Add Output |
Here, we can can decide which of the five types of output we would like. Just to see them, let's choose them all, including the Advanced Functions that can be seen by checking the box in the bottom-left corner.
.JPG) |
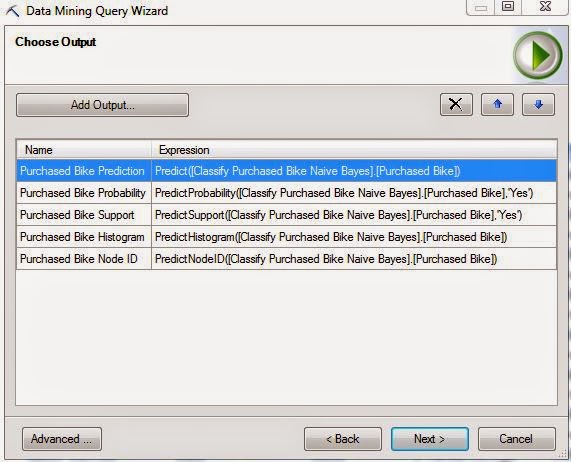
| Choose Output (Complete) |
Let's move on.
.JPG) |
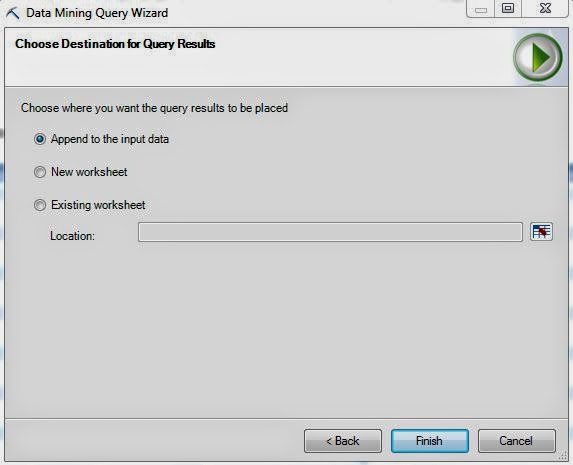
| Choose Destination (Purchased Bike) |
Here, we can choose to append the results to our data set. Let's check them out!
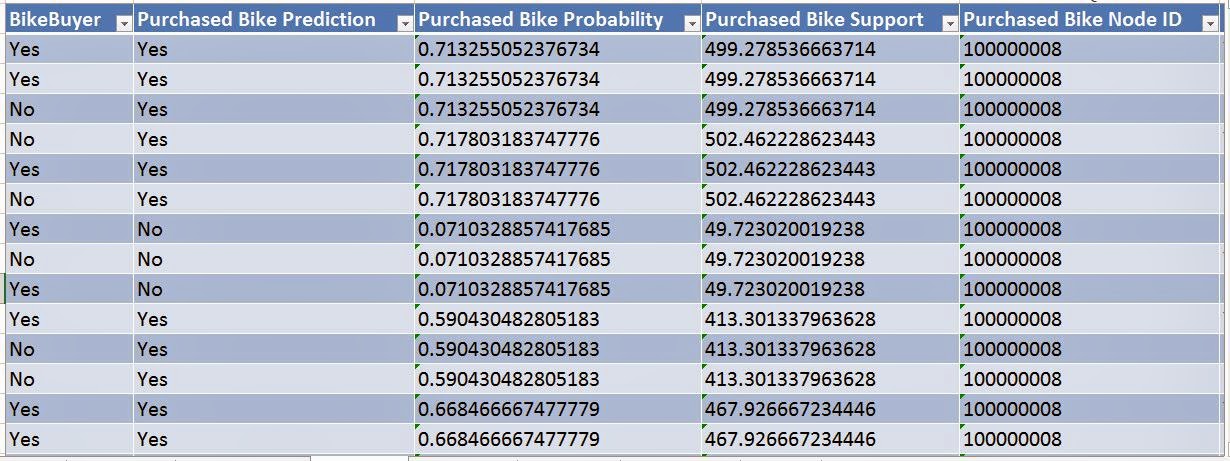 |
| Results |
We have so much information in front of us now. The really important pieces are the Predictions and Probabilities. Now, we can compare known Bike Buyer values to our Predictions to see how well our model actually works. We can also see that larger probabilities correspond to Yes values while smaller probabilities correspond to No values. We won't go any further into detail about this area. But we will say that there is a TON more to do here. This functionality also exists in SQL Server Analysis Services and can be used for even more cool stuff. We'll leave you with one final piece. In a few of the windows we looked at, there's an "Advanced" button. Clicking on it will give you a snippet of a programming language called DMX.
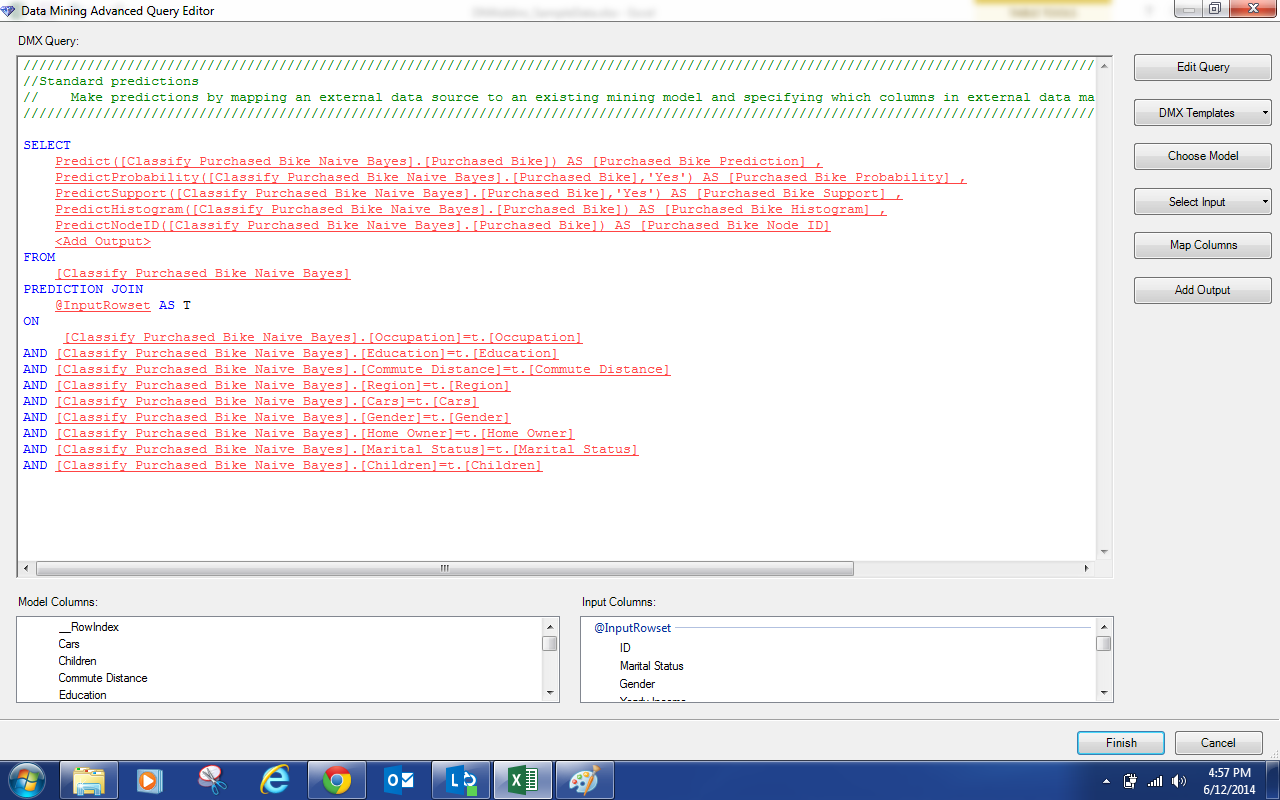 |
| Query Editor |
You can alter this to create almost anything you want. You can even use this as a good way to learn DMX. We hope you enjoyed this series and want to take what you've learned here and apply it to your data. Thanks for reading. We hope you found this informative.
Brad Llewellyn
Director, Consumer Sciences
Consumer Orbit
llewellyn.wb@gmail.com
http://www.linkedin.com/in/bradllewellyn
No comments:
Post a Comment