 |
| Sample Waterfall Chart |
| Row ID | Date | Description | Amount | Daily Posted Balance |
| 2 | 4/2/2013 | Direct Deposit | $485.00 | $1,596.56 |
| 3 | 4/2/2013 | Rent | ($804.74) | $791.82 |
| 4 | 4/4/2013 | Food | ($16.00) | $775.82 |
| 5 | 4/4/2013 | Car | ($374.43) | $401.39 |
| 6 | 4/5/2013 | Cable | ($34.23) | $367.16 |
| 7 | 4/8/2013 | Direct Deposit | $1,598.75 | $1,965.91 |
| 8 | 4/8/2013 | Gas | ($39.56) | $1,926.35 |
Step 1:
- Create a Negative Amount calculation
- Create the following calculation
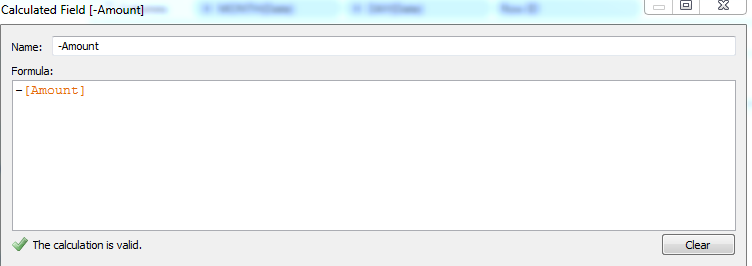 |
| Negative Amount |
- Drag MONTH( [Date] ), DAY( [Date] ) and [Row ID] to the Columns Shelf
- Drag [Daily Posted Balance] to the Rows Shelf
- Drag [Amount] to the Colors Shelf, play with it if you choose
- Drag [-Amount] to the Size Shelf
- Drag [Description] and [Date] to the Details/Tooltip Shelf
 |
| Waterfall Chart |
Now, we can see a simple representation of our account balance throughout the month. However, what if your data set doesn't contain a nice [Daily Posted Balance] field. Have no fear, you can recreate it using table calculations. Obviously, we would lose the ability to see the start balance, but that's a topic for another post.
Step 1.5:
- Create a Running Sum of Amount
- Create the following calculation
 |
| Balance |
- Create the same chart as before, using [Balance] instead of [Daily Posted Balance]
- Also, you will need to place [Description] and [Date] on the Tooltip Shelf this time
.PNG) |
| Waterfall Chart (with Running Sum) |
Brad Llewellyn
Associate Consultant
Mariner, LLC
llewellyn.wb@gmail.com
https://www.linkedin.com/in/bradllewellyn
https://www.linkedin.com/in/bradllewellyn
Hello Brad,
ReplyDeleteIs there a way to automatically update a value into set or parameter from datasource,For example: If I want to show YTD I have column which says current Month and other column which says Current year.So this current month column gets updated every month and I have a set which has current and previous years, but I want to add my forthcoming year which will come to data source
as 201401 as current month and the set should say 2014 which needs to be selected as well. and the year 2012 needs to be deselected.
Is there any way we can accomplish this in Tableau :)
Please let me know if I have confused you
Thanks,
Kathir
Kathir,
DeleteWould something like this work?
http://breaking-bi.blogspot.com/2013/02/creating-period-to-date-matrix-in.html
Thanks,
Brad Llewellyn
Associate Consultant
Mariner, LLC
brad.llewellyn@mariner-usa.com
http://www.linkedin.com/in/bradllewellyn
http://breaking-bi.blogspot.com
Dear Brad, what do you think about this? http://fincontrollex.com/?page=products&lang=en
ReplyDeleteThis tool allow to get waterfall charts directly in excel workbook and have some convenient features
That's really cool! One of the fun things about Excel is how much you can do with it you really want to. Thanks for sharing.
DeleteHi how to create water fall chart overlap or stacked waterfall chart give me solution
ReplyDelete