Monday, April 25, 2016

Power BI/PowerPivot: Using Power Query to Add Negative Return Rows to a Transaction Table

Today, we're going to talk about how to add negative rows to your transaction table using Power Query.  Many IT installations have some sort of transaction table showing what they buy and sell.  Many of those businesses also have a practice of allowing customers to return items purchased.  In most of these cases, the business wants to be able to identify when an item was returned.  However, there are different ways to handle this problem.  For instance, you could simply remove the order from the transaction table.  However, this leaves no evidence that the order was ever placed at all.  Another method is to add another row to the transaction table with the same Order ID, but takes a negative quantity and a negative sales amount.  This would not affect your total sales, because the values would be added and then subtracted, causing a net of 0.  It also leaves evidence of the return.  You can also place a flag somewhere else in your database showing which orders were returned and which were not.  Let's look at how to accomplish this task using a simple data source.

We start with our Orders table.
Orders
This table shows us the Row ID, Order ID, Order Date, and Product Name for every order, as well as the Quantity and Sales.  Now, let's take a look at the Returns table.
Returns
The Returns is just a list of Order IDs that have been returned.  We could approach this differently if we were provided with a Return Date or a specific product that was returned.  Alas, this is what we have.

Let's start by duplicating our data source so that we can keep the original for testing purposes.
Duplicate
Now, we can start working our new Orders table, which we have renamed Orders (with Negatives).  The first thing we need to do is identify which orders were returned.  The easiest way to do this is with Merge Tables.
Merge  Queries
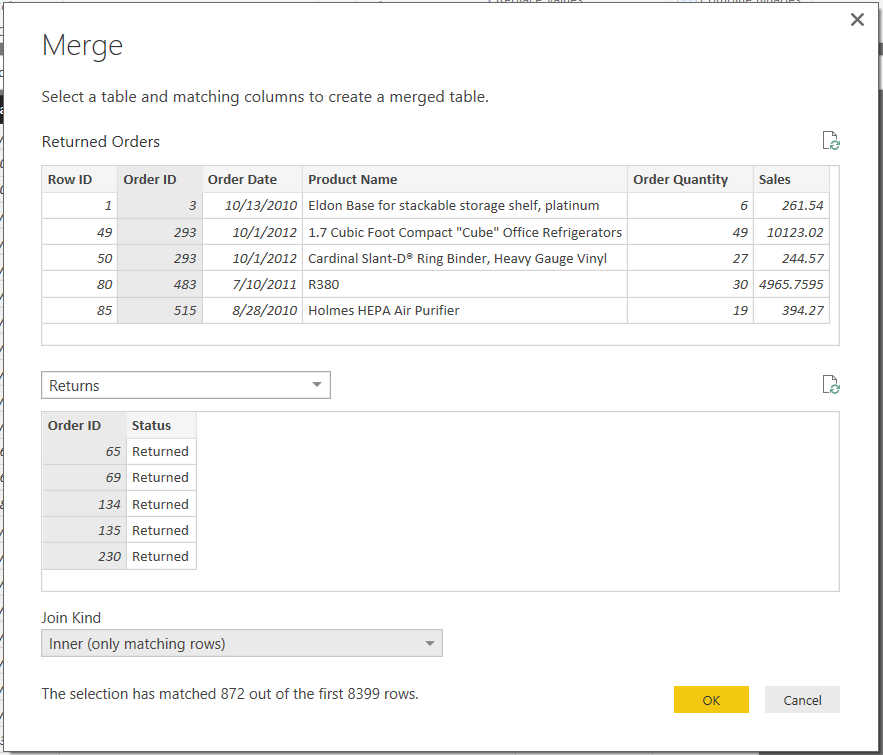
For our purposes, we want to find all of the Orders in the Orders table that were returned.  This can be accomplished by Inner Joining the tables on the Order ID key.  However, doing this will throw away all of the rows that don't have returns.  So, let's start by duplicating the Orders (with Negatives) table again, then do the Inner Join between Orders (with Negatives) (2), which we will call Returned Orders, and the Returns table.
Merge
This leaves us with the Orders table, but only the rows that were returned.
Returned Orders
You may notice that these are exactly the orders we wanted to negate from the original table.  We can do this by multiply Sales and Quantity by -1.
Multiply
Now, we have 2 new columns representing the -Quantity and -Sales.
Returned Orders (with Negative Columns)
Next, we need to remove the original Quantity and Sales columns and rename the negative columns to Quantity and Sales, respectively.  For cleanliness, we can also remove the Status column, as it was only used for demonstration.
Returned Orders (Clean)
Now, we're ready to add these rows to our original table.  Actually, since we're reserving the original table for testing purposes, we're actually appending this to the Orders (with Negatives) table.
Append Queries
Because of the table size, we can't see any of the negative rows in the Power Query preview.  So we need to pull all of this out to Power BI and take a look.  This is exactly why we kept the original table.
Validation
We can see that the sales and quantity for non-returned orders was not affected.  However, the new sales no longer includes items that were returned, while still maintaining those rows in the transaction table.  Thanks for reading.  We hope you found this informative.

Brad Llewellyn
BI Engineer
Valorem Consulting
@BreakingBI
www.linkedin.com/in/bradllewellyn
llewellyn.wb@gmail.com

Monday, April 4, 2016

Power BI/PowerPivot: Creating a Simple Data Model

Today, we're going to talk about how to set up a simple data model in Power BI Desktop and PowerPivot.  The data set we are going to be using can be found here.  Simply put, a data model is a set of tables designed to work together.  For instance, having a table showing all of your sales is great.  However, what if you want to compare your sales across different product lines, but your product line information is in a different table?  This is the type of situation we're going to solve today by building a simple data model.  Every data model starts by looking at your data.  Our dataset consists of 3 tables, Orders, Returns, and Users.
Orders
Returns
Users
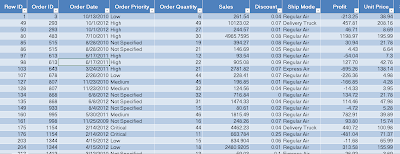
The Orders table contains transaction data about each order.  This includes the products that were purchased, how much they paid for them, when they purchased them, etc.  This is an extremely common type of table that exists in virtually every business.  Next, the Returns table is a lookup table letting us know which orders were returned.  Lastly, the Users table shows us which managers are assigned to which regions.  Let's start by pulling all of the tables into Power BI Desktop.
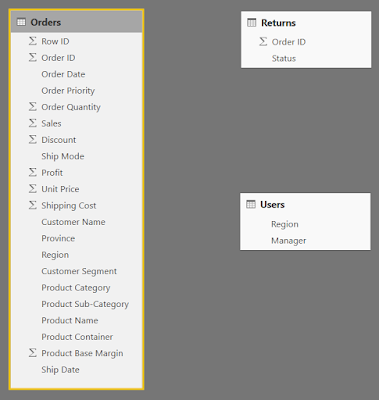
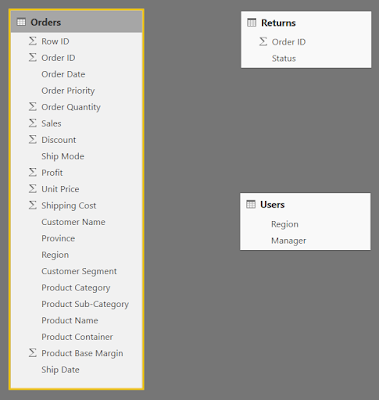
Data Model (No Connections)
Power BI tries to find relationships between the tables and make connections.  Fortunately for us, it didn't find any.  This means that we get to walk through the process from the beginning.  Generally, the purpose of a data model is to connect lookup tables to transaction tables.  Depending on the style of data architecture being used, these tables may also be referred to as Facts and Dimensions.  Simply put, your Transaction or Fact tables contain the values you want to aggregate (sum, count, average, etc.) and your Lookup or Dimension tables contain the values you want to slice, filter, or group by.  For more information on Facts and Dimensions, check out this link or google Kimball vs. Inmon.

Now that we've identified what each of the tables are, we can start looking at how "clean" they are.  "Clean" is a term that generally refers to how usable a data set is for a specific purpose.  For data modeling, you generally want your transaction tables to be flat.  This means that each column should be a unique metric or slicer.  Imagine that we had a dataset that contained a column for "2011 Sales" and "2012 Sales".  We would want to pivot those down to a year column taking the values 2011 and 2012, and a Sales column that takes the appropriate value from the old columns.  In our case, the data set is clean enough for an introduction.  One thing that does stick out is the Product Hierarchy.  There are columns for Product Category, Product Sub-Category, and Product Name.
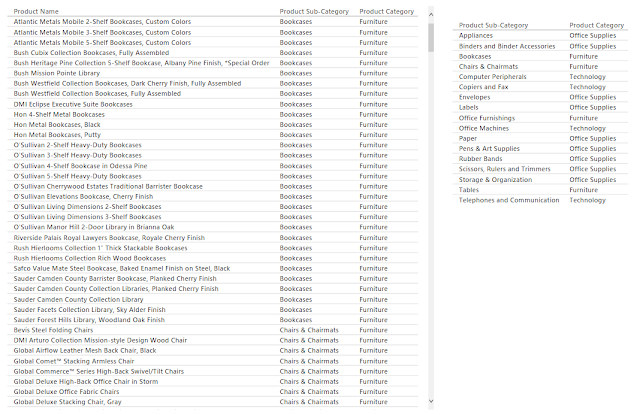
Product Hierarchy
If we look through the hierarchy, we can see that each Product Name exists in only 1 Product Sub-Category and each Product Sub-Category exists in only 1 Product Category.  This means that they form a perfect hierarchy.  Best practices suggest that these values should be split into their own lookup table(s).  However, this is a more advanced process that we'll handle in a later post.  There is a task that we need to take care of now though.  If we look at the Orders table in the Relationships canvas, we see that quite a few columns are flagged with a Sigma (∑).
Data Model (No Connections)
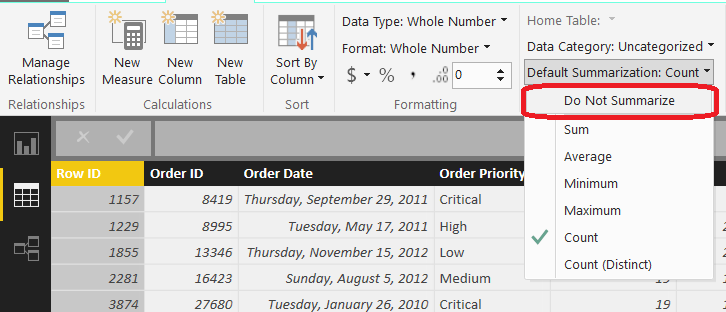
When the data set was imported, Power BI looked at these columns and decided that they should be aggregated because they are numeric.  For columns like Sales, this is true.  However, we have some columns that are actually numeric slicers, such as Discount and Product Base Margin, as well as numeric keys, such as Row ID and Order ID.  These columns should not be aggregated.  We can fix this by moving on to the Data canvas and changing the Default Summarization for each of these columns.
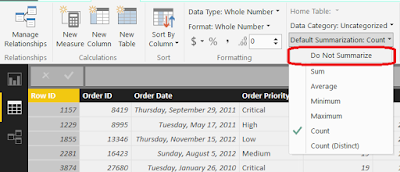
Do Not Summarize
 Doing this for all appropriate columns leave us with a very different picture of the table in the Relationships canvas.
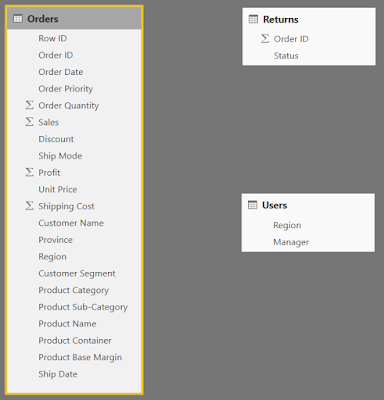
Data Model (Clean Orders)
Now, we can call the Orders table clean enough for our needs and move on to the Returns table.
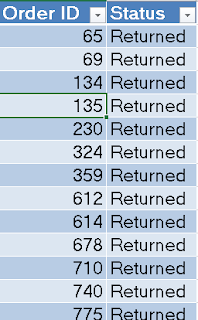
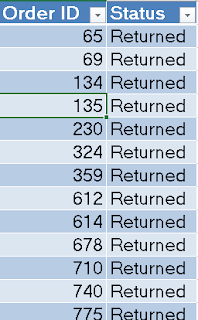
Returns
This table shows each Order ID that was Returned.  In many transactional systems, another row would be added to the transaction table with a negative value and quantity to show that an item was returned.  Doing so would allow all metrics to still calculate correctly, while still having the evidence of a return.  This is another case that we'll have to cover in another post.  In our case, we'll leave it like it is.  Finally, we recognize that Order ID is a key column.  Key columns are used to connect tables to each other.  In a perfect model, you would like a key to be unique in the lookup table but not unique in the transaction table.  This is not always the case in the real world, but it happens to be here.  Each Order ID appears only once in the Returns table.  Just like before, we need to change the Default Summarization of Order ID so that Power BI does not attempt to aggregate it.

Next, we need to connect the Returns table to the Orders table.  In Power BI Desktop, this is a simple task.
Data Model (Clean Returns)
First, open the Relationships canvas.
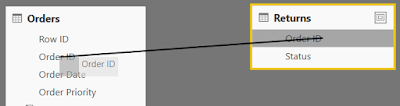
Create Connection
 Next, click-drag "Order ID" from the Returns table onto "Order ID" from the Orders table.
Data Model (Connected Returns)
This created a "one-to-many" relationship from Returns to Orders.  This is exactly what we wanted.  Now, we can create charts using "Status" as a slicer against measures from the Orders table.  Let's move on to the Users table.
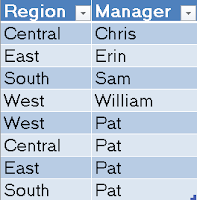
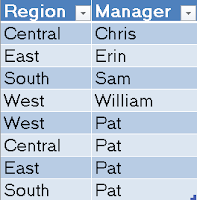
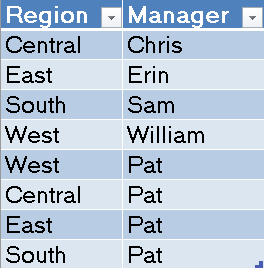
Users
This table is a bit more interesting.  We have each of the managers tied to their respective regions.  However, we also have the CEO Pat tied to every region.  This means that Region is not a unique key in this table.  We want to remove Pat's rows from the bottom of the table, and add a new column labeled CEO which would take the value "Pat" for all 4 rows.  There are some great ways to handle this using the Query editor (also known as Power Query).  However, we'll take the easy way this time and save the hard work for a later post.

Let's start by opening the Query Editor.
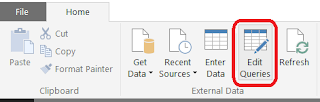
Edit Queries
The query editor is where you can edit your Data Import queries in a number of ways to get exactly the format you want.  Let's open the Query for the Users table.
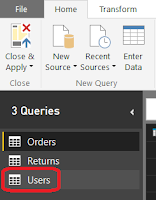
Select Users Query
This shows us what the Users table currently looks like, as well as shows us every step that was taken to create it.
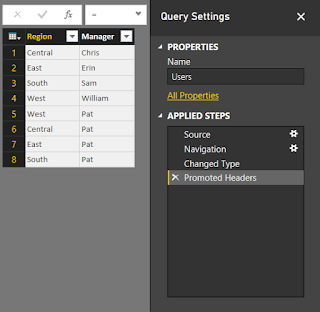
Users Query
Since we didn't mess with the queries, all of the steps listed are the defaults.  What we want to do is remove the bottom 4 rows.  We can do this by selecting the "Remove Bottom Rows" option from the toolbar and typing in the number 4.
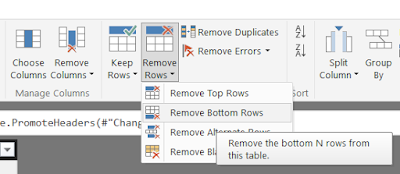
Remove Bottom Rows
This leaves us with only the legitimate managers in the table.
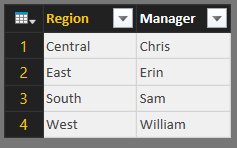
Users Table (Legit)
Now, we apply these changes and go back to our model.
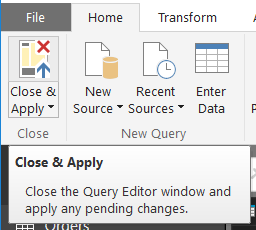
Close and Apply
Next, we need to add the CEO column and give it the value "Pat" for all rows.  We start by navigating to the Data canvas and select the  "New Column" button.
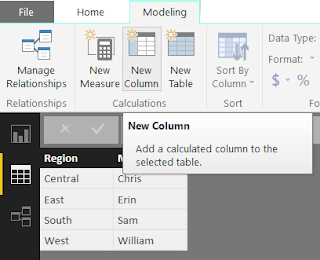
New Column
Next, we type the function CEO = "Pat" into the function bar.
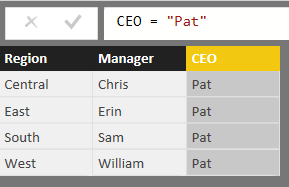
Users Table (Clean)
This will automatically rename the column to CEO and populate it with "Pat" for every row.  Finally, we need to connect this table to the Orders table using the Region key.
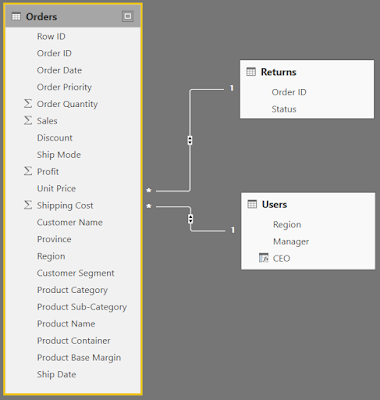
Data Model (Complete)
Now, we can slice and dice our Orders data by any of the slicers we want, including the slicers in the Returns and Users tables.  Hopefully, this opened your eyes to how easy it is to build simple data models in Power BI Desktop.  Stay tuned for later posts where we get more in-depth on how to handle these problems using best practices, as well as deal with more difficult issues.  Thanks for reading.  We hope you found this informative.

Brad Llewellyn
BI Engineer
Valorem Consulting
@BreakingBI
www.linkedin.com/in/bradllewellyn
llewellyn.wb@gmail.com

Monday, March 14, 2016

Power BI: Exploring your Data

Today, we're going to use Power BI to explore our data.  Let's say that someone hands us an Excel file and we want to know what's going on in it.  The sample data set we are using can be found here.  This workbook contains 3 sheets with data.  Let's try to import it into Power BI Online.
Get Data
Get Data from File

File Not Supported
Turns out that this file was created using a very old version of Excel.  This means that we need to convert it to a new version, then we can upload it.
No Data
Now it's telling us the file has no data in it.  But, we know that it has 3 tabs of data.  Turns out that Power BI doesn't look at the tabs at all.  It looks for tables.  So, we need to turn each set of data into a table, for a total of 3.  Now that we have the data uploaded to Power BI Online, we can start exploring.  Where do we start?  Turns out that Power BI Online will do that for us via the Quick Insights option.
Quick Insights
Quick Insights for Sample
This is amazing!  It churned through our data and showed us a some key features without us doing any work at all.  It doesn't just show us the 4 insights above.  The list continues on for pages and pages.  Some of the insights are quite interesting.  For instance, it shows that Technology is by far the most profitable Category and Tables are the least profitable Sub-Category.  Unfortunately, Power BI Online did not recognize the relationships between the tables automatically.  More to that point, there doesn't seem to be a way to create a data model from Power BI Online.  It seems that Power BI Online is designed as a way to share your insights, not to replace Power BI Desktop or any other modeling/ETL tool.
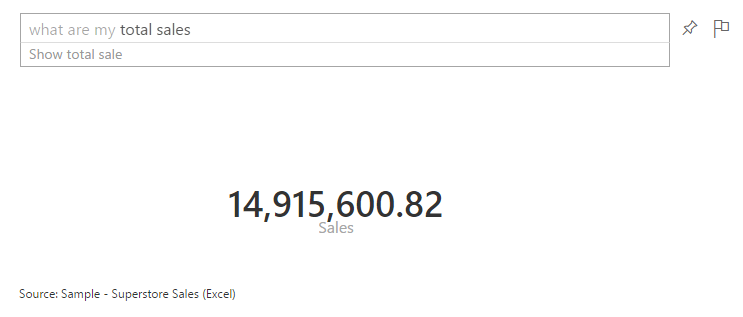
There's one more cool thing you can do with Power BI Online.  You can ask natural language questions to your data using the Q&A feature.
Q&A
If you create a dashboard using the Sample data, you can ask Power BI a question, and it will try to answer it for you.  For instance, what happens if we ask "What are my total sales?"
What are my total sales?
As you can see, it translates this question into "data-speak" so that the Power BI can return the appropriate query.  Amazingly, it doesn't seem to mind when you throw more logic at it.
What are my total sales for 2012?
What are my total sales of Tables for 2012?
This is definitely one of the coolest things we've seen an analytics tool do.  Power BI Online definitely shows its chops when it comes to fast answers.  An interesting addition to the Q&A feature is Cortana.  You can enable Cortana to query Power BI Online directly from your Windows machine.  This functions in the same way that Q&A does, without requiring that you go through the browser to ask.  You can find more information on that here.  Now that we've seen how cool Quick Insights and Q&A can be, let's move over to Power BI Desktop and start tinkering.

Interestingly enough, Power BI Desktop is capable of connecting to the original Excel file, even though it's not a recent version.  Moreover, it can also connect directly to the tabs instead of us having to assign tables.  It also attempts to automatically detect relationships so that we don't have to explicitly define them.  As a note, automatic relationship detection may not work if you have unorthodox relationships or your columns are not named the same.  We'll talk more about modelling in a later post.  As you can see, we have modeled the data appropriately.
Relationships
There doesn't seem to be a Quick Insights or Q&A option in Power BI Desktop.  This is likely because it is designed more as a Power User tool, as opposed to a standard business user tool.  However, since our data is properly modeled, there's nothing stopping us from creating some charts.
Order Date
 We start by dragging Order Date onto an empty Power BI Desktop Canvas.
Sales by Order Date
 Then, we drag Sales onto the chart.  Power BI decides to display this as a bar chart.  Generally, when we are looking at an additive metric (like Sales) over time, we want to see it as a line.
Sales by Order Date (Line)
We can easily do that by clicking the "Line" button in the "Visualizations" panel.  Now, let's split these lines by Category.
Sales by Order Date and Category
We can do that by simply dragging Category onto the chart.  What if we want to look at these at the Month-Year Level?  It turns out that this is one of the places where Power BI falters.  Not all charts have all capabilities.  For instance, there doesn't seem to be a way to drill down a line chart.  You can only show one dimension at a time.  We even decided to create a new column in our data model called Order Month and dragged it onto the chart.  We could not have Year and Month on the chart at the same time.  Therefore, if you want to see Month Year, you have to create a single calculated column that combines the two or better yet, have a date dimension that does it for you.  Fortunately, Matt Masson blogged about a way to do this using Power Query.  You can find the post here.  Now, we've run into the problem of using string names (which are sorted alphabetically, but this can be changed) or using YearMonth numerics, such as 200901 (which have huge gaps between 200912 and 201001).  Either way, this is disappointing.  Fortunately, bar charts give the option to drill-down.  So, we have something we can use, even if it's not perfect.
Sales by Year
Sales by Quarter
A caveat of this approach is that you can't show multiple quarters across multiple years at the same time without using more advanced hierarchies.  You can either drill down into a single year (by clicking on the bar) or drill down across all years (by clicking the "Double Down-Arrow" button in the top-left).  Hopefully, someone in the community has come up with a good workaround for this.  Alas, we have seen some very powerful options for a free tool.  Stay tuned for more posts about the new Power BI.  Thanks for reading.  We hope you found this informative.

Brad Llewellyn
BI Engineer
Valorem Consulting
@BreakingBI
www.linkedin.com/in/bradllewellyn
llewellyn.wb@gmail.com