Today, we're going to talk about Nested LoDs in Tableau. Just like with Table Calculations, you can't always get the right answer with a single LoD. So far, we've generally been dealing with SUM(), MAX(), and MIN(). These are unique because we know that the SUM() of a SUM() is the same as applying the SUM() over the entire set. Similar logic applies to MAX() and MIN(). However, not all calculations work like this. For instance, AVG() and COUNT() vary depending on the grain of the data. Therefore, you have to be more careful when you use them. Let's look at an example.
In
Part 5, we looked at number of unprofitable items. This was simple because our data set is at the item level. What if we wanted to look at number of unprofitable orders? Let's walk through it.
 |
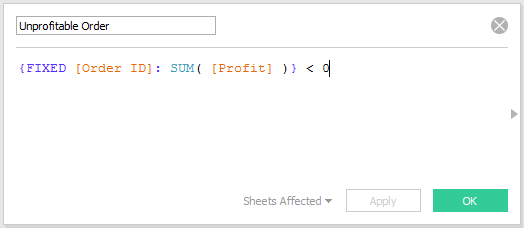
| Unprofitable Order |
We start by identifying which Orders are profitable. We can do this by summing [Profit] to the [Order ID] level, then checking if that is less than 0.
 |
| Profit by Order ID |
Next, we want to know how many unprofitable orders each customer has.
 |
| Number of Unprofitable Orders |
We can calculate this by replacing the T/F values with 1/0 values (using the INT function), and summing them up from the Order level to the Customer level.
 |
| Number of Unprofitable Orders by Customer |
Once you get to be slightly more experienced, you can do this in a single calculation.
 |
| Number of Unprofitable Orders (Single Calc) |
 |
| Number of Unprofitable Orders by Customer (Single Calc) |
There's one thing you may have noticed about the nested LoDs. The inner LoD was not FIXED on the dimension included in the outer LoD. The inner LoD was calculated at the Order level, then that was summed up to the Customer level. In this case, it's fine because each order belongs to only 1 customer. If this was not the case, then we'd have to explicitly define Customer in both LoDs.
 |
| Number of Unprofitable Orders (Single Calc) v2 |
 |
| Number of Unprofitable Orders by Customer (Single Calc) v2 |
At this point, you may have noticed that our Outer LoDs isn't actually necessary. Since the chart is at the same grain as the Outer LoD (the Customer level), we don't actually need it.
 |
| Number of Unprofitable Orders (Single LoD) |
 |
| Number of Unprofitable Orders by Customer (Single LoD) |
You might be asking, "How does this calculation teach us about nesting if we don't even need to nest it?" The nesting comes in handy when you want to step one level further. What is we wanted to know the average number of Unprofitable Orders per Customer, for each Segment?
 |
| Number of Unprofitable Orders by Segment |
As you can see, applying the SUM() (Red) to the LoD does not require nesting. This is exactly what we talked about at the beginning of the post. However, if you want to apply a different aggregation, like AVG() (Orange), then you need to nest.
Once again, we've run into the same issue with Segment as we did with Customer Name. This only works because each Customer exists in only one Segment. What happens if we swap Segment out for Category? Will the total Orders still add up to 554 + 302 + 166 = 1022?
 |
| Number of Unprofitable Orders by Category |
We can see that the Total correctly shows 1022 unprofitable orders. However, the values in the column add up to much more than that. This is because the unprofitable orders usually span multiple categories. In fact, we can see that there are only two unprofitable orders that didn't involve Office Supplies. So, is this right or wrong? That depends on what you want out of each. These numbers tell the story that "963 unprofitable orders contain Furniture". Depending on what question you want to answer, you can use INCLUDE or EXCLUDE statements as well.
One final cool feature we want to point out here is that you can use these values to answer more questions. For instance, what percentage of unprofitable orders contain Furniture?
 |
| Percentage of Unprofitable Orders |
 |
| Percentage of Unprofitable Orders by Category |
We just combined an LoD with a Table Calculation! We could have also done this using another nested LoD. Hopefully, LoDs have opened up a whole new world for you within Tableau. They certainly have for us. Thanks for reading. We hope you found this informative.
The workbook for this post can be found
here.
Brad Llewellyn
Business Intelligence Consultant
llewellyn.wb@gmail.com
http://www.linkedin.com/in/bradllewellyn