Today, we will look at how to properly use IF Statements in Tableau, as well as a trick I find indispensable in most of my work. Basically, an IF statement is a statement that returns different values based on a set of conditions. A very simple example is as follows:
IF [Year] = 2012 THEN "2012" ELSE "Other" END
This statement returns the string "2012" if [Year] = 2012, and "Other" if [Year] <> 2012. (For those who are less techy, <> is the "not equal to" operator.) As usual, we will use the Superstore Sales sample data set in Tableau.
Step 1:
- Create a graph of Sales by Container
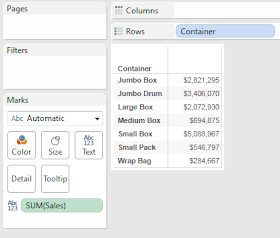 |
| Sales by Container |
Step 2:
- Categorize the Containers by how much Sales they generate
- Create the following calculated field
 |
| Container Category |
Step 3:
- Add [Container Category] to the graph to check the results
.PNG) |
| Sales by Container (with Container Category) |
We've created a simple calculation that tells us how our Containers are performing, without having to scan through a list of numbers. We could make this even easier by adding colors, or using something other than a text table. However, we'll leave that up to you.
Let's shift over to that trick we mentioned earlier. Let's say you want to calculate the total sales for your containers like we did earlier. However, the Boxes should only be calculated for the last 30 days and everything else should be calculated for the last 45 days. We've often received the question "How do you calculate a total over the last X days for one product and Y days for another?" You're about to see!!!
Step 1:
- Create the graph of Sales by Category
- Filter the graph to only show the last 30 days
Wait a minute!!! If we filter the graph to only show the last 30 days, all of the containers will show the last 30 days; the same goes for 45 days. How do we make them different?
Step 2:
- Remove the Date filter (if you added it at all)
- Calculate the 30 day sum for boxes and 45 day sum for the other categories
- Create the following calculated fields
This is a complex step; so, we'll walk through it step-by-step. First, decide which type of container you have as follows:
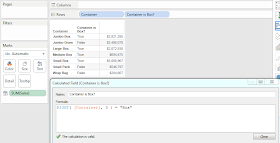 |
| Container is Box? |
Next, we need to create a parameter so that we can alter our anchor date for this calculation. In practice, you could also use TODAY() or a custom field you create in the back-end.
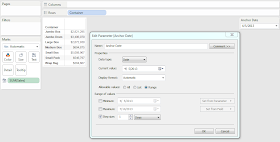 |
| Anchor Date |
Now, let's use [Anchor Date] and [Container is Box?] to create our calculation.
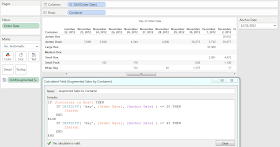 |
| Augmented Sales by Container |
This graph is a little messy because of sparcity in the data. However, you will notice that there are no [Sales] for Boxes before December 1, 2012, which is exactly 30 days before [Anchor Date]. We could check to make sure that the other Containers stop after 45 days, but it's easier to take my word for it and move on. Finally, we can plot our new sums using whatever graph fits our fancy.
 |
| Final Graph |
What makes this trick so neat is that the rows for days beyond 45 are still in the data set, yet they have no values for [Augmented Sales by Container]. This means that we could still add other types of data to this chart. (Egregious use of different time frames is not wise though.) Also, the other aggregation functions, such as Average and Maximum, will still work on this data as well because Tableau does not consider NULL values when it calculates an aggregation. I hope you found this informative. Thanks for reading.
Brad Llewellyn
Associate Consultant
Mariner, LLC
llewellyn.wb@gmail.com
https://www.linkedin.com/in/bradllewellyn


.PNG)
.PNG)

.PNG)



.PNG)


.PNG)


.PNG)
.PNG)