Today, we will talk about performing K-Means Clustering in Tableau. In layman's terms, K-Means clustering attempts to group your data based on how close they are to each other. If you want a rudimentary idea of how it looks, check out
this picture. Avid readers of this blog will notice that some of our previous posts, such as
Simple Linear Regression and
Z Tests, attempted to bring some hardcore statistical analysis into Tableau. These posts required an extensive knowledge of statistics and Tableau. Now, with Tableau 8.1's R integration, we can do even cooler stuff than that. For those of you that don't know, R is a free statistical software package that is heavily used by Academic and Industry statisticians. The inspiration for this post came from a post on the Tableau website. You can read it
here.
Microsoft's "Data Mining with SQL Server 2008" gave a perfect analogy for why you would want to use a clustering algorithm. Feel free to read it
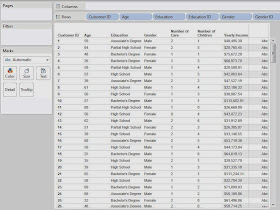
here. With this in mind, imagine that you have a bunch of demographic data about your customers, age, income, number of cars, etc. Now, you want to find out what groups of customers you really have. Take a look at some sample data we mocked up.
 |
| Sample Data |
First, we need to examine our attributes. In order to do this, we need to understand the difference between discrete and continuous attributes. Simply put, a discrete attribute has a natural ordering, yet can only take a small number of distinct values. Number of Children is a great example of this. The values are numeric, which gives them a distinct ordering and there's a natural cap to how high this number can be. It's extremely uncommon to see anyone with more than six children or so. On the other hand, a continuous attribute can still be ordered, but takes far too many values for you to be able to list them all. Income is a great example of this. If you lined up all of your friends in a room, it's extremely unlikely that any of you would make the same exact amount of money. An easy way to distinguish between these is to ask yourself, "Could I make a pie chart out of this attribute?" If you answered yes, then the attribute is discrete. If you answered no, then it is continuous. Please note that this a gross oversimplification of these definitions, but they are good enough for this post. Feel free to google them if you want to know more.
Now, let's see kinds of attributes we have.
Customer ID: Unique Key
Age: Continuous
Education: Discrete
Gender: Discrete*
Number of Cars: Discrete
Number of Children: Discrete
Yearly Income: Continuous
*Gender is technically a categorical attribute. We'll touch back on this later.
Another important thing to note is that the K-Means Algorithm in R requires numeric input. Therefore, we had to replace Education and Gender with numeric IDs. Partial High School is a 1 and Doctorate Degree is a 6, with everything in the middle ordered appropriately. Female is 0 and Male is 1. This would have been an issue if we had a categorical attribute with more than two levels.
Now, we should also note that the R scripting functions qualify as Table Calculations. Therefore, you need to set up your canvas before you can send the appropriate values to R. Let's start by setting Customer ID on the Detail Shelf. This defines the granularity of the chart.
 |
| Customer ID |
Now, we need to create the calculated field that will create the clusters. This code is commented (comments in R start with #) so that you can read it more easily.
SCRIPT_INT("
## Sets the seed
set.seed( .arg8[1] )
## Studentizes the variables
age <- ( .arg1 - mean(.arg1) ) / sd(.arg1)
edu <- ( .arg2 - mean(.arg2) ) / sd(.arg2)
gen <- ( .arg3 - mean(.arg3) ) / sd(.arg3)
car <- ( .arg4 - mean(.arg4) ) / sd(.arg4)
chi <- ( .arg5 - mean(.arg5) ) / sd(.arg5)
inc <- ( .arg6 - mean(.arg6) ) / sd(.arg6)
dat <- cbind(age, edu, gen, car, chi, inc)
num <- .arg7[1]
## Creates the clusters
kmeans(dat, num)$cluster
",
MAX( [Age] ), MAX( [Education ID] ), MAX( [Gender ID] ),
MAX( [Number of Cars] ), MAX( [Number of Children] ), MAX( [Yearly Income] ),
[Number of Clusters], [Seed]
)
Basically, this code sends our six attributes to R and performs the clustering. We also passed two parameters into this code. First, we made a parameter that can change the number of clusters. Second, we made a parameter that sets the seed. A seed is what determines the output from a "random" number generator. Therefore, if we set a constant seed, then we won't get different clusters every time we run this. This is EXTREMELY important to what we are about to do.
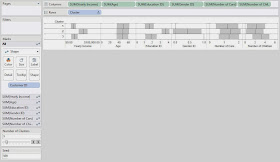
Now, we want to examine our clusters on an attribute-by-attribute basis so that we can determine what our clusters represent. In order to do this, we made the following chart:
.JPG) |
| Clusters (Seed 500) |
This chart is nothing more than a bunch of Shape charts, with the Transparency set to 0 so that we can't see the shapes. Then, we put -1,+1 standard deviation shading references and an average reference line on each chart. Next, our goal is to look at each chart to see how the clusters differ. We will use very rough estimation when we look at these charts. Don't beat yourself up over the tiny details of which box is bigger or which line is higher; this isn't an exact science.
On the Yearly Income chart, we see that Clusters 1 and 3 are pretty close, and Cluster 2 is much higher. So, we'll say that Cluster 2 is "Wealthy."
On the Age chart, we don't see a significant difference between any of the Clusters. So, we move on.
On the Education ID chart, we see that Clusters 1 and 3 are pretty close again, and Cluster 2 is much higher. So, we'll call Cluster 2 "Educated." Shocking Surprise! Educated People seem to make more money. It's almost like we built the data to look like this. Anyway, moving on.
On the Gender ID chart, we see that Cluster 1 is almost entirely female and Cluster 3 is almost entirely male.
On the Number of Cars chart, we don't see a significant difference between the clusters.
On the Number of Children chart, we see that Cluster 3 has more children than the other clusters. So, we'll call this Cluster "Lots of Children".
Now, let's recap our clustering:
Cluster 1: "Male." We'll call this cluster the "Average Males"
Cluster 2: "Wealthy", "Educated." We'll call this cluster "Wealthy and Educated"
Cluster 3: "Female", "Lots of Children." We'll call this cluster "Females with Lots of Children"
Now, before anybody cries sexism at us, we will say that we intentionally created a relationship between income and education. However, the fact that gender and number of children were clustered together were purely random chance.
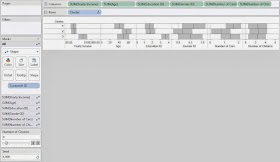
This leads us to another question. What if you don't like the clusters you got? What if they weren't very distinguishable or you thought that the random number generator messed up the clusters. Easy! Just change the seed and/or the number of clusters.
.JPG) |
| Clusters (Seed 1000) |
Changing the seed to 1000 completely changed our clusters. This is what's so cool about statistics. There are no right answers. Everything is up for interpretation.
Now, you might ask, "If the clusters change every time, why is this even useful?" That's the singular defining question behind statistics and the answer is typically, "Run it more than once." If you create 10 sets of clusters and 9 of them pair High Income with High Education, then that's a VERY good indication that your data contains that cluster. However, if you run it 10 times and find that half of the time it groups Men with High Income and the other half of the time it groups Women with High Income, then that probably means there is not a very strong relationship between Gender and Income.
We're sorry that we couldn't explain in more depth how the R functionality or the clustering algorithm works. It would probably take an entire book to fully explain it. Feel free to do some independent research on how clustering algorithms work and how to interpret the results. We encourage you to experiment with this awesome new feature if you get a chance. If you find a different, and maybe even better, way of doing this, let us know. We hope you found this informative. Thanks for reading.
P.S.
We would have much rather represented our discrete attributes, or categorical in the case of Gender, using some type of bar graph. However, we were completely unable to find a way to get it to work. If you know of a way, please let us know in the comments.
Brad Llewellyn
Associate Data Analytics Consultant
Mariner, LLC
brad.llewellyn@mariner-usa.com
http://www.linkedin.com/in/bradllewellyn
http://breaking-bi.blogspot.com

.JPG)

.JPG)
.JPG)
.JPG)
.JPG)


.JPG)
.JPG)
+(Power+Pivot).JPG)
+(Power+Pivot).JPG)
.JPG)
.JPG)
+(Tableau).JPG)
+(Tableau).JPG)
.jpg)
.JPG)
+(Tableau).JPG)
+(Tableau).JPG)
+(Tableau).JPG)


.JPG)
.JPG)


.JPG)
.JPG)
+(Power+Pivot).JPG)
.JPG)
.JPG)
.JPG)
.png)
.JPG)
.JPG)
+(Tableau).JPG)
.JPG)
.JPG)
+(Tableau).JPG)
.JPG)

.JPG)
+(Power+Pivot).JPG)

.JPG)
.JPG)