Today, we will talk about Top N% Filters in Tableau. In our opinion, there are two types of Top N% Filters. These are showing the top N% of Customers by Profit or the Customers that correspond to the top N% of Sales. To our knowledge, neither of these features are built-in to Tableau, yet they can be easily achieved using calculated fields. As usual, we will use the Superstore Sales sample data set in Tableau.
First, we will look at the Top N% of Customers.
Step 1:
- Create a chart of Profit by Customer, sorted by SUM( Profit )
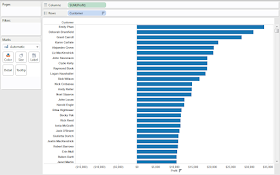 |
| Profit by Customer |
Step 2:
- Create a parameter for the N% you want
- Duplicate the parameter
- We will use the 2nd parameter for the 2nd filter
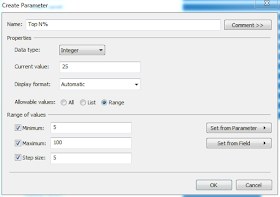 |
| Top N% Parameter |
Step 3:
- Calculate the Total Number of Customers
- Create the following calculated field
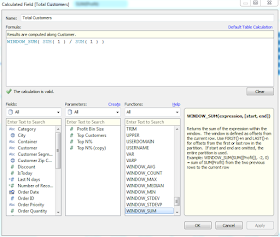 |
| Total Customers |
For those of you who read this blog often, you will recognize this method. It is an extremely simple method for executing a distinct count. Basically, it adds 1 for each row of Customer.
Step 4:
- Create a calculated field that returns true for customers less than or equal to the cut-off point.
- Create the following calculated field
- Add it to the filters shelf, filtering on "True"
 |
| Top N% Filter 1 |
Now, let's see if it works.
.PNG) |
| Profit by Customer (Filter 1) |
As you can see, there are a lot less customers in this chart than the original. You can play with the parameter to make sure it works. Now, let's work on filtering Customers that correspond to the Top N% of Sales. You might wonder why we don't just use Profit again. Since, Profit can, and sometimes will, be negative, you will get funny results if you use this technique on it. You are welcome to do it on your own to see.
Step 1:
- Create a chart of Sales by Customer, sorted by SUM( Sales )
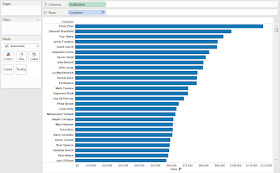 |
| Sales by Customer |
Step 2:
- Calculate the Total Sales
- Create the following calculated field
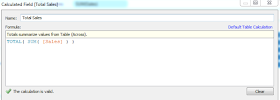 |
| Total Sales |
We could have used WINDOW_SUM() here, just like we did earlier. However, we'd imagine that WINDOW_SUM() is slower than TOTAL(), so we used TOTAL() here, primarily because this is exactly what TOTAL() is meant for.
Step 3:
- Calculate the Running Sum of Sales
- Create the following calculated field
 |
| Running Sum of Sales |
Step 4:
- Calculate which Customers are above the threshold
- Create the following calculated field
- Add it to the Filters Shelf, filtering on "True"
 |
| Top N% Filter 2 |
Now, let's see the results.
.PNG) |
| Sales by Customer (Filter 2) |
As you can see, calculated fields are very powerful when it comes to creating custom filters. I hope you found this informative. Thanks for reading.
Brad Llewellyn
Associate Consultant
Mariner, LLC
llewellyn.wb@gmail.com
https://www.linkedin.com/in/bradllewellyn





.PNG)


.PNG)


.PNG)