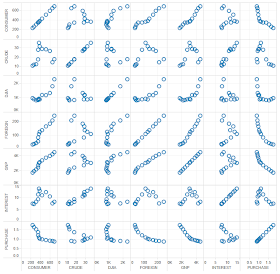
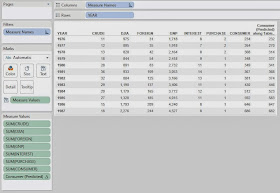
First, let's look at our data.
 |
| DJIA vs. Foreign by Year |
.JPG) |
| DJIA vs. Foreign by Year (with Linear Trend) |
.JPG) |
| DJIA vs. Foreign by Year (with Quadratic Trend) |
.JPG) |
| DJIA vs. Foreign by Year (with Exponential Trend) |
.JPG) |
| DJIA (Quadratic) |
.JPG) |
| DJIA (Exponential) |
We see that all we have to do is make a new variable with whatever function we want and add it to the model. As far as R knows, these are two completely different variables. We could add all of the other variables to the mix as well if we wanted to. We could easily model Foreign as a quadratic while modeling Consumer as a logarithm. One important thing to note is that if you include a polynomial, you should include all lesser degrees. Simply put, if you have a x^2, then you must also have x. If you have x^3, you must also have x^2 and x. We won't go into detail about why you should do this at this time.
Looking back at the earlier trends, we're not happy with either of these trends. The quadratic trend has that troubling curvature at the left side while the exponential trend doesn't seem strong enough to capture the upward curvature. Now, let's make a new model that Tableau doesn't even have!
Looking back at the earlier trends, we're not happy with either of these trends. The quadratic trend has that troubling curvature at the left side while the exponential trend doesn't seem strong enough to capture the upward curvature. Now, let's make a new model that Tableau doesn't even have!
What if we believe that there are actually two trends here? Let's imagine that the relationship is linear for small values of Foreign (less than 135) and a different linear relationship for larger values of Foreign? No problem! We can combine our models!
SCRIPT_REAL("
djia <- .arg1
fore <- .arg2
th <- 135
fore2 <- fore^2
smallfore <- fore[fore<th]
smalldjia <- djia[fore<th]
largefore <- fore[fore>=th]
largedjia <- djia[fore>=th]
smallfit <- lm( smalldjia ~ smallfore )
largefit <- lm( largedjia ~ largefore )
c(smallfit$fitted, largefit$fitted)
",
SUM( [DJIA] ), SUM( [FOREIGN] ) )
Finally, let's see the results.
.JPG) |
| DJIA vs. Foreign by Year (with Piecewise Prediction) |
This model fits our data so much better! This method is called Piecewise Regression. The amazing thing about R is that there's a method for predicting anything you want. You can even create your own prediction method if you need to. Thanks for reading. We hope you found this informative.
P.S.
We're curious how Tableau keeps track of which value in the output vector corresponds to each input. This was a huge obstacle in Part 3 as well. If you have ideas, let us know in the comments.
P.S.
We're curious how Tableau keeps track of which value in the output vector corresponds to each input. This was a huge obstacle in Part 3 as well. If you have ideas, let us know in the comments.
Brad Llewellyn
Data Analytics Consultant
Mariner, LLC
llewellyn.wb@gmail.com
https://www.linkedin.com/in/bradllewellyn
Data Analytics Consultant
Mariner, LLC
llewellyn.wb@gmail.com
https://www.linkedin.com/in/bradllewellyn

.JPG)

.JPG)
.JPG)
.JPG)


.JPG)
.JPG)
.JPG)
.JPG)


.JPG)

.JPG)