Today, we're going to talk about using LoDs as Dimensions in Tableau. Up until now, we've only been using LoDs as measures on our charts. However, they can also be used as dimensions if you're careful. One important caveat to note is that only FIXED LoDs can be used as dimensions because a dimension can not depend on what is already in the chart. This is why Table Calculations are always measures. Let's start by looking at ways to classify customers. What if we wanted to classify customers by the number of unprofitable items they've bought?
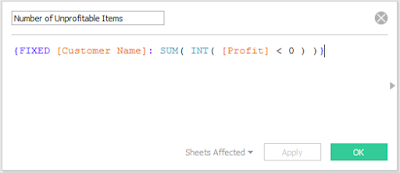 |
| Number of Unprofitable Items |
The inner expression [Profit] < 0 flags each row with a TRUE/FALSE if it's an unprofitable item. Then, we change those to 1/0 values and sum them up by customer. If we drag this onto the chart as a dimension, it actually gets pushed down to the row-level of our underlying data, as if it were a dimension in the data set. This allows us to apply measures on top of it.
 |
| Number of Customers by Number of Unprofitable Items |
You can even view the underlying data to confirm that the calculation works.
 |
| Number of Customers by Number of Unprofitable Items (with Underlying Data) |
Unfortunately, the Number of Unprofitable Items field will not appear in the underlying data because it's calculated at runtime. Alas, this does give you some way to double check your calculations.
Since this field is now a dimension, we can even filter on it.
 |
| Sales by Year for Customers with at Least 3 Unprofitable Items |
We do warn you to be careful with these types of situations, you may end up with incorrect calculations. For instance, when you have year on the chart, does the LoD calculate for each year or does it calculate once, filter the underlying data source, and make a chart based on the filtered data source? Our intuition says the latter. Let's test it.
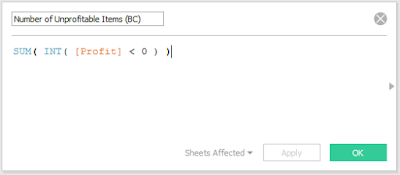 |
| Number of Unprofitable Items (BC) |
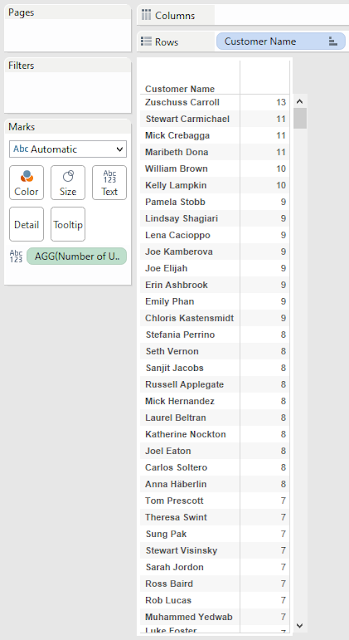 |
| Number of Unprofitable Items by Customer |
We can see that Zuschuss Carroll is the only customer with 13 unprofitable items. Let's see what his/her Sales by Year are.
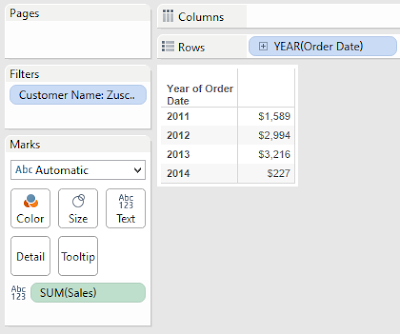 |
| Sales by Year (Zuschuss Caroll) |
His/her Sales for 2011 is $1,589. Next, let's filter our first Sales by Year chart to show "exactly 13" Unprofitable Items instead of "at least 3".
 |
| Sales by Year for Customers with 13 Unprofitable Items |
This is exactly what we saw when we filtered on Zuschuss Caroll directly. This is amazing news. We now know that filtering by an LoD does not take into account what's on the chart. What about the other side? When the LoD is placed on a chart, does it take into account the filters?
 |
| Sales by Number of Unprofitable Items for 2011 |
We see that $1,589 is the same number we saw when we filtered on Zuschuss Caroll. This isn't especially surprising. In
Part 2, we established that FIXED LoDs always compute before traditional filters. This brings up another interesting question. What happens if we add the Year filter to the Context?
 |
| Sales by Number of Unprofitable Items for 2011 (Context) |
There is no longer a row for 13. This signals to us that the filter is taking place BEFORE the LoD. It's a great sign to the simplicity of LoDs that the reality matches our expectations. However, let's take it one step further. What happens if you add an LoD filter to Context? Does an infinite loop within Tableau rip a hole in the universe? Let's find out.
 |
| Unprofitable Items by Year and Customer |
The first numeric column you see is the LoD. As we now know, it doesn't care if Year is also in the chart, it calculates across all years. After that, we see the Basic Calculation version calculated for each year, followed by the total. For now, this total matches the LoD. Let's see what happens when we filter out rows with an LoD equal to 0.
 |
| Unprofitable Items by Year and Customer (Traditional Filter) |
It filters out all rows with an LoD value of 0, as we expected. Now, what happens if we add this filter to Context?
 |
| Unprofitable Items by Year and Customer (Context Filter) |
Nothing happens. The filter acts the same whether it is context or traditional. The real question is "How does this context filter interact with other filters?" An LoD should always be calculated after Context Filters and before Traditional Filters. This would lead us to believe that the following order takes place:
1) Non-LoD Context Filters are computed
2) FIXED LoDs are computed
3) Context is recomputed using LoD Context filter
4) Traditional filters are computed
This seems somewhat inefficient. Calculating the Context can be quite cumbersome depending on your data. Calculating it twice would make it even worse. Let's see if this is the case.
 |
| Sales by Year for Customers with 13 Unprofitable Items (Context) |
We've seen this chart before. Now, what will happen if we add a traditional filter for 2011. The LoD filter should calculate first, then the Year filter. This means that the only row in the output should be 2011 with a value of $1,589.
 |
| Sales for Customers with 13 Unprofitable Items in 2011 (Traditional) |
So far, so good. Now, let's add the Year filter to Context. If our above hunch was correct, the chart should go blank. This would indicate that the Year filter is being taken into account before the LoD is calculated, thereby requiring the Context to be build twice.
 |
| Sales for Customers with 13 Unprofitable Items in 2011 (Context) v2 |
Interestingly enough, we were wrong. The Year context filter was not calculated before the LoD. This is an interesting find. For one, it means that Tableau's not as inefficient as we expected it to be. Second, it means that we found an exception to the "Context before FIXED" rule. In fact, it seems that ALL context filters, regardless of origin, are calculated before other FIXED LoDs. This brings up another interesting question. Is there any way to have a FIXED Context Filter affected by other filters? It doesn't seem like it. Alas, maybe someone will leave a comment with an idea.
That's all we're going to discuss about this today. We learned a tremendous amount about LoDs and hope you did too. Thanks for reading. We hope you found this informative.
The workbook for this post can be found
here.
Brad Llewellyn
Business Intelligence Consultant
llewellyn.wb@gmail.com
http://www.linkedin.com/in/bradllewellyn


