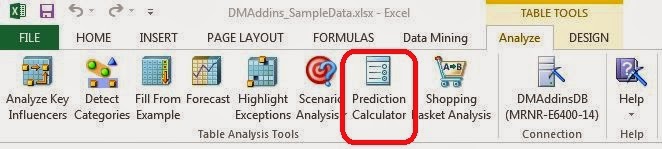
Today, we will be talking about one of the more interesting Table Analysis Tools, Prediction Calculator.
 |
| Prediction Calculator |
Imagine that you are a marketing analyst that buys a list of prospective customers from a vendor. These lists come with data such as Income, Gender, Number of Children, etc. Now, you want a simple formula that will quickly score each customer on whether they are likely to buy your product(s). For instance, if they score greater than 500, then they are worth contacting. This is what the Prediction Calculator does. Let's see it in action. As usual, we will use the Data Mining Sample data set from Microsoft.
 |
| Column Selection |
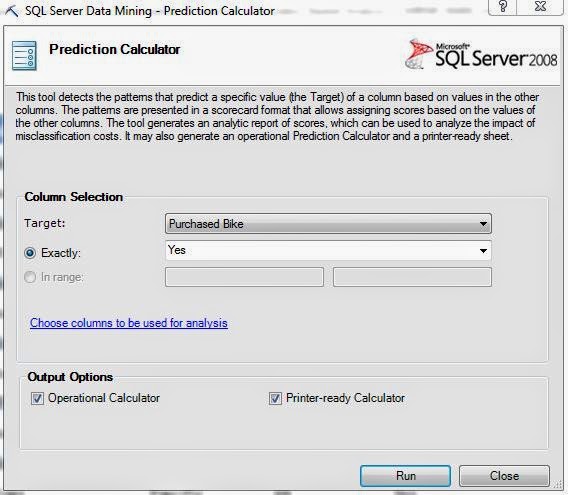
First, we have to tell the algorithm the value that we want to see. In our example, this is "Purchased Bike = Yes". We can optionally choose to exclude some columns from the analysis if the need arises. Finally, we are given two optional outputs, Operational Calculator and Printer-ready Calculator. We will show you both of these outputs later in the post. First, let's look at the first output sheet, Prediction Report. This output sheet is always displayed, regardless of which output options you select.
 |
| Profits and Costs |
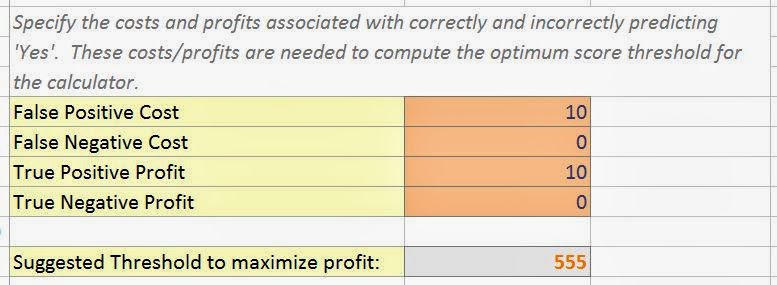
The first component of this report is the Profit and Cost matrix. Let's go one line at a time to see what these values mean. If you market to a potential customer and they do not buy your product, then you have spent money on the marketing but have gained no profit. This is called "False Positive Cost". If you do not market to a potential customer and they would have bought your product, then you have lost potential profit. We can't think of a case where this would actually cost you anything because you aren't actually doing anything. However, it is possible and is known as "False Negative Cost". If you know of a situation where this value would exist, let us know in the comments. If you market to a customer and they buy your product, then you have spent money on marketing and made money from the sale. The money from the sale should be higher than the cost to market, else you aren't going to be in business very long. This value is known as "True Positive Profit". Finally, if you do not market to a customer and they would not have bought your product, then you saved money on marketing. Once again, doing nothing doesn't typically cost money, so we're unsure how to use this field. However, the algorithm does account for it and it is called "True Negative Profit". Once we fill these values in, the algorithm calculates the threshold you should employ in order to maximize your profit. It also shows you a handy graph to the side.
 |
| Profit Chart |
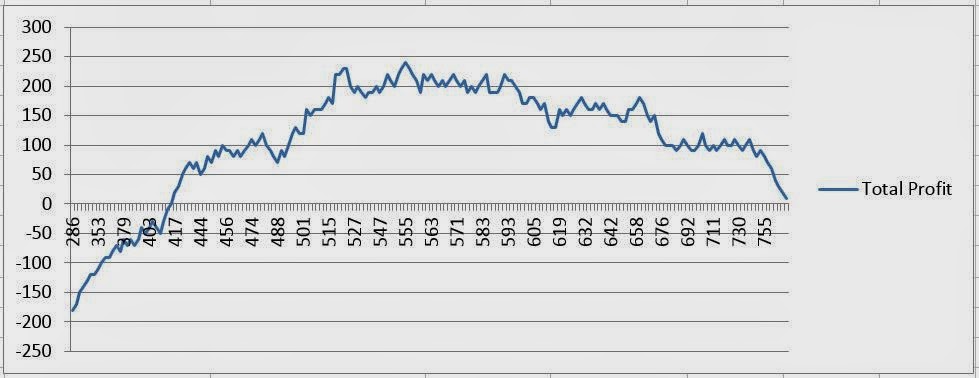
This is known as a profit chart and we will see it again later in the series. This profit chart tells us the estimated profit if we employ a certain threshold. For instance, if our threshold is too low, then we are marketing to too many people who will not buy our product. In that case, we would spent more on marketing then we would make from Sales. On the other end, if our threshold is too high, then we don't market to enough customers, causing our sales to be low. Let's look further down the sheet for more information.
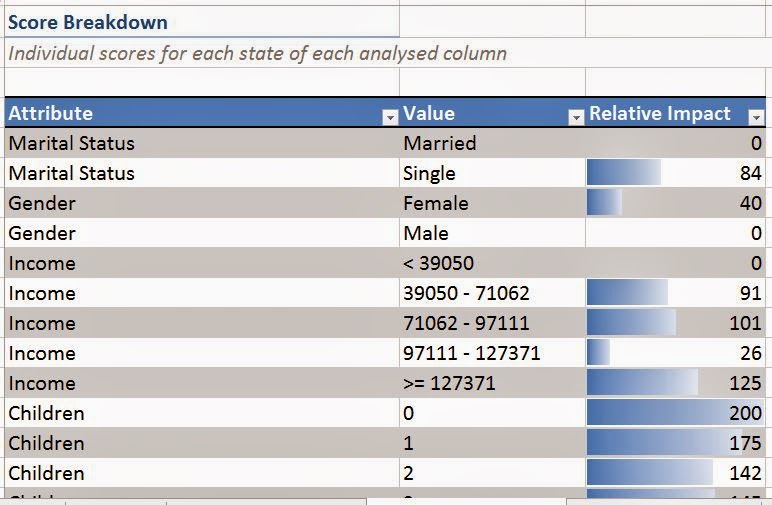 |
| Score Breakdown |
This chart shows you every possible value from the data set, as well as how many points that value would earn the customer. This is useful for seeing which attributes are good predictors for buying a bike.
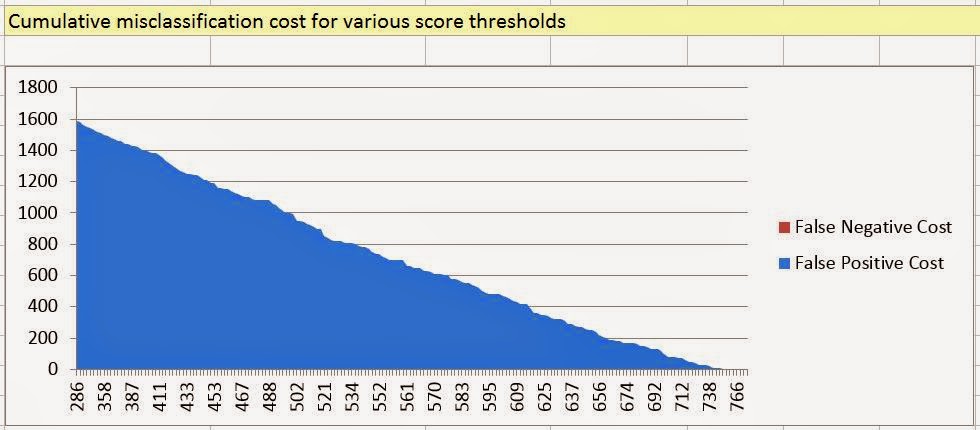 |
| Cumulative Misclassification Cost |
To the side of the Score Breakdown, we have a chart that displays the Cumulative Misclassification Cost. In Layman's terms, this cost shows you the estimated cost of "wasted" marketing for each of these thresholds. No matter the threshold, there will be someone who doesn't fit the model and will not buy your bike. This chart attempts to show you just how severe that cost would be for each threshold. Obviously, the lower the threshold, the more people you market to. In turn, this means that more people will say no. Let's move on to the first optional output, Prediction Calculator.
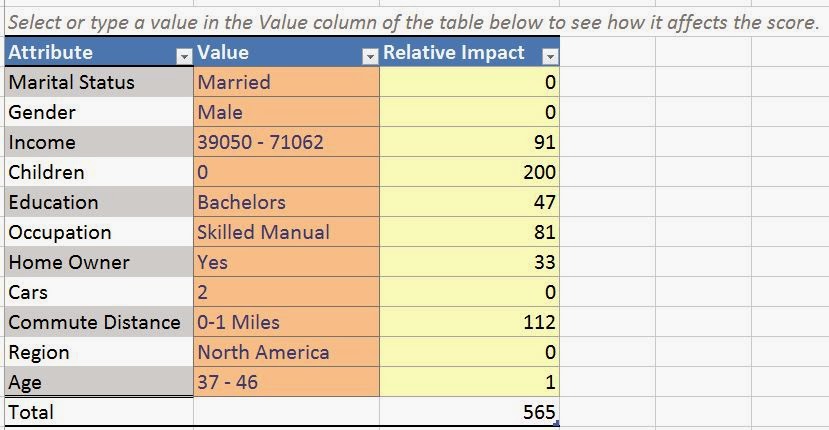 |
| Prediction Calculator |
This sheet appears if you select the "Operational Calculator" option. Here, you can enter the customer's attributes and the algorithm will give them a total score. If the total score is greater than the threshold, then you should market to them. Pretty simple indeed. Finally, let's look at the Printable Calculator.
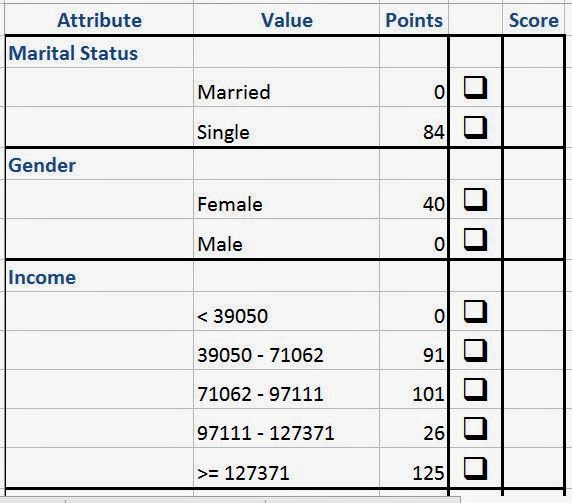 |
| Printable Calculator |
This sheet appears if you select the "Printer-Ready Calculator". This sheet is especially useful if you are doing door-to-door sales and won't have access to a computer to use the Operational Calculator. You simply check each option and tally up the scores.
The Prediction Calculator tool is extremely useful for marketing purposes. In fact, we've never seen any tool quite like it, especially given that it's free if you already own Analysis Services. Stay tuned for the next post where we'll be talking about the final Table Analysis Tool, Shopping Basket Analysis.
Brad Llewellyn
Director, Consumer Sciences
Consumer Orbit
llewellyn.wb@gmail.com
http://www.linkedin.com/in/bradllewellyn


.JPG)
.JPG)


