Today, we will talk about What-If Analysis in Tableau. What-If Analysis is when you propose a hypothetical scenario and use it to see how it will affect your business. A simple example is, how much will my profit increase if I stop doing business with unprofitable customers? As usual, we will use the Superstore Sales sample data set in Tableau.
Step 1:
- Find the unprofitable customers
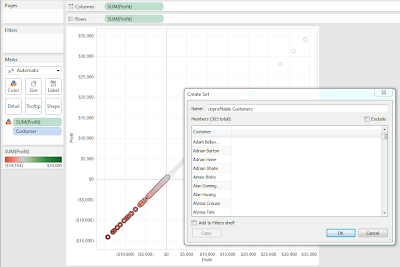 |
| Unprofitable Customers |
Step 2:
- Create a line graph of Profit per Year, segregated by Profitable/Unprofitable Customers
- Use the Pages Shelf to hide the Unprofitable line.
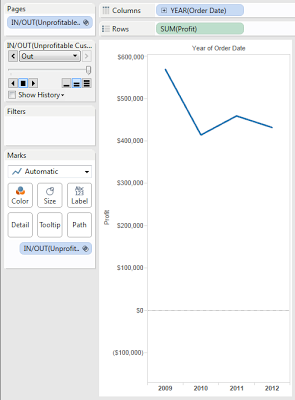 |
| Profit by Year, from Profitable Customers |
Step 3:
- Calculate the Total Profit using both Profitable and Unprofitable Customers
- Create the following table calculation
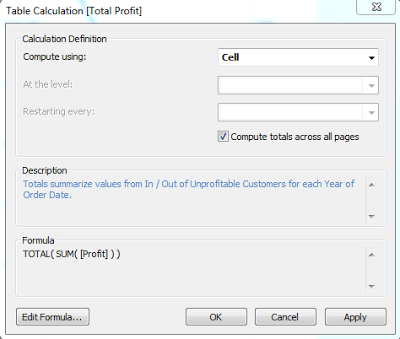 |
| Total Profit |
Step 4:
- Use this table calculation to create a synchronized, dual-axis line chart.
 |
| Total Profit and Profit from Profitable Customers by Year |
As you can see, there is a pretty significant increase in Profit if we stop doing business with unprofitable customers. Some of you may say, "This isn't the kind of What-If Analysis I'm used to!!!" You're right. This example was useful for showing the strength of Tableau in the area.
Now, let's look a more traditional What-If Analysis. What would happen to my profit if I decreased my shipping cost by X%?
Step 1:
- Create a parameter for the X%
 |
| Shipping Cost Decrease Percentage |
Step 2:
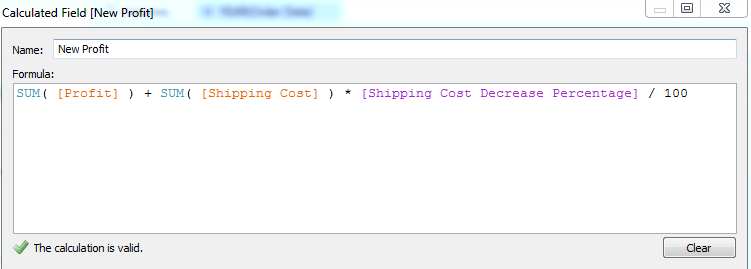
- Calculate the new profit
- Create the following calculated field
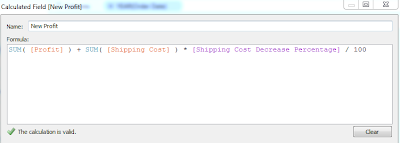 |
| New Profit |
Some of you might be asking, "Why did you calculate profit that way?" The simple answer is, I didn't have the right variables in my data set to calculate Profit the traditional way, i.e. Profit = Sales - Costs. At its simplest, this way adds the Shipping Cost back into the Profit. There are some much more complicated ways to do something like this, but for the sake of simplicity, we'll keep it like this for now.
Step 3:
- Create a line chart to compare Profit and New Profit by Year
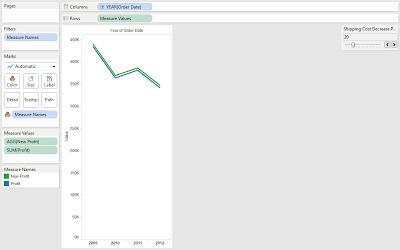 |
| Profit and New Profit by Year |
As you can see, if you can decrease shipping costs by 20%, you can increase profit by about 1% or 2%. While these aren't substantial numbers, there's a very important concept to remember. Shipping is a notoriously inefficient business. It's not uncommon for companies to reduce shipping costs 20% or 30% just by using a new piece of technology or creating a new initiative. Also, it's pretty easy to make your boss smile if you can show him a way to increase his profits by a few percent each year. I hope you found this informative. Thanks for reading.
Brad Llewellyn
Associate Consultant
Mariner, LLC
llewellyn.wb@gmail.com
https://www.linkedin.com/in/bradllewellyn


.PNG)

.PNG)


+(Corrected).PNG)
+Test.PNG)
.PNG)