Today, we will look at how to calculate the "median" of Likert Scale in Tableau. Median is in quotes because this is not a true median, it is more like a weighted average. However, I believe it gives you far more information than a true median and, therefore, is worth pursuing. For those of you who are not familiar with a Likert Scale, it is as follows:
1 - Strongly Disagree
2 - Disagree
3 - Neither Agree nor Disagree
4 - Agree
5 - Strongly Agree
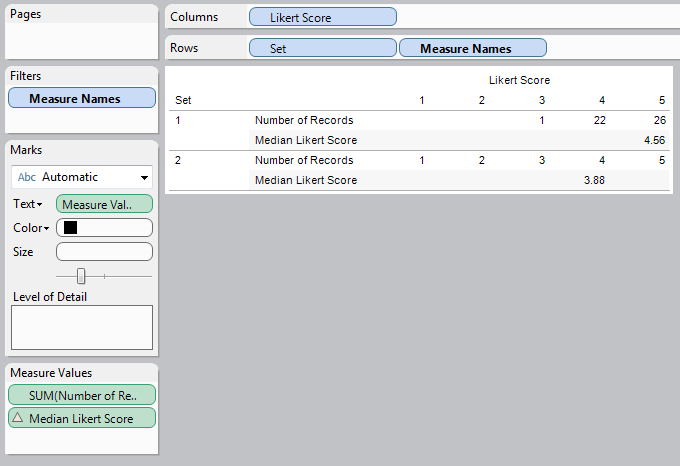
This is the common 5-point version; however, there are adaptations of 6 and 7 points as well. On the bright side, the algorithm in this post will work for any number of points with no alterations. For the first time, I had to create my own data set for this post. The sets are as follows:
 |
| Sample Data |
Step 1:
- The median record is found as a traditional median, i.e. Total Number of Records / 2.
- Create the following calculated field
 |
| Median Record |
 |
| Median Record Test |
Step 2:
- Find the upper threshold for each Likert Category, i.e. Calculate the Cumulative Number of Records.
- Create the following calculated field
 |
| Cumulative Number of Records |
 |
| Cumulative Number of Records Test |
- Using these upper thresholds, find the Likert Category corresponding the Median Record, i.e. < Threshold( Likert Category - 1 ) < Median Record <= Threshold( Likert Category ).
 |
| Median Likert Category |
 |
| Median Likert Category Test |
Step 4:
- Find how "far" into the Likert Category the Median Record is, i.e. (Median Record - Lower Threshold of Likert Category) / Number of Records in this Likert Category
- Create the following calculated field
 |
| Number of Values into Likert Category |
 |
| Number of Values into Likert Category Test |
Step 5:
- Find the starting value of the Likert Category, i.e. the average of Likert Category and Likert Category - 1 = Likert Category - .5
- Create the following calculated field
 |
| Start of Likert Category |
 |
| Start of Likert Category Test |
Step 6:
- Take the Starting Value of the Median Likert Category, add the Number of Values into the Likert Category, i.e. Starting Value of Category + Number of Values into Category.
- Apply this calculation only to the Median Likert Category (It is incorrect for every other category)
- Create the following calculated field
 |
| Median Likert Score |
 |
| Final Result |
We hope you found this informative. Thanks for reading.
Brad Llewellyn
Associate Consultant
Mariner, LLC
llewellyn.wb@gmail.com
https://www.linkedin.com/in/bradllewellyn
https://www.linkedin.com/in/bradllewellyn
Will this work if your dataset has multiple scales? For example, a survey that has some questions with a 1-5 response and other questions with a 1-9 response?
ReplyDeleteIf you have some way of slicing them, i.e. a dimension that takes values "Question 1" and "Question 2", then I see no reason why this wouldn't work. Feel free to experiment with it.
Delete